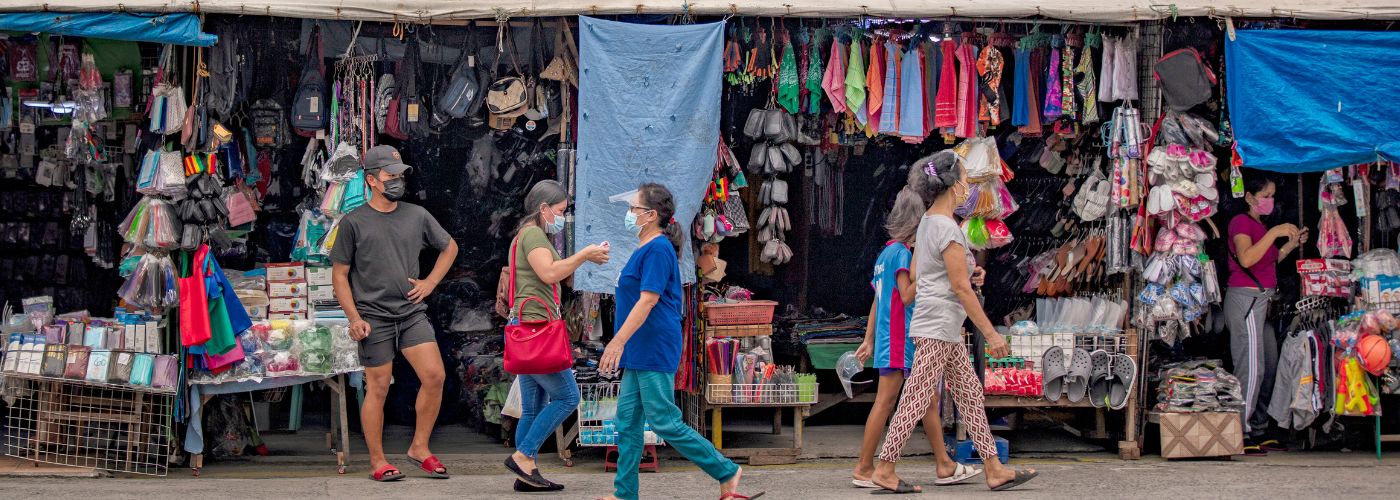
 Stalls are seen outside a mall on September 16, 2021 in Bacoor, Cavite province, Philippines. ©World Bank
East Asia prides itself on rapid economic progress over the past few decades with millions lifted out of poverty. Between 2008 and 2018, real per capita GDP in the region grew at an average rate of 6.7 percent per year, significantly above the global average of 1.5 percent. Yet the extent of progress on poverty is exaggerated by the fact that poverty thresholds are set too low compared to other countries at similar income levels. This leads to policies which do not do justice to the scale of the problem. New numbers released by the World Bank using global benchmarks underscore this point.
The World Bank updated its global poverty lines last month and the number of poor is now significantly different in certain countries and regions. These periodic updates are carried out to reflect changes in prices and adjustments to national poverty lines. Global poverty lines are largely used to assess whether the world is on track to meet global goals such as the SDG goal of eradicating extreme poverty by 2030. In our view, they matter at the national level too, particularly in East Asia and Pacific (EAP) where several large countries have lagged behind in updating their own national lines. Keeping poverty lines at levels far below average incomes has in turn led to an under-emphasis on inclusive growth and social protection policies and a sense that the fight against poverty has been largely won. These new numbers remind us once again that there is no room for complacency.
The three global poverty lines, updated to $2.15, $3.65, and $6.85 per day, reflect the typical national poverty lines of low-income (LIC), lower-middle-income (LMIC), and upper-middle-income countries (UMIC), in 2017 prices and adjusting for purchasing power. For the EAP region, the global poverty line update changes our view of the number of people who fall below thresholds for middle-income countries. At the LMIC standard, an additional 33 million people are poor, primarily because compared to the 2011 PPP, the 2017 PPPs imply higher price levels.
At the UMIC poverty line, there are nearly 175 million more poor. One of the main reasons for the large jump in EAP numbers using the UMIC threshold is because many UMIC countries have raised their national poverty lines in real terms. This is neither surprising, nor unusual. Globally, we see that national poverty lines tend to increase with income levels, as countries raise the minimum standards by which they determine people to be poor (Jolliffe and Prydz, 2016). In addition to the price changes, the update to World Bank’s global UMIC line reflects that countries are holding themselves to these higher standards.
EAP countries should update their poverty benchmarks
Are these reasonable standards to use for EAP countries which are largely middle-income? As Figure 1 shows, there is a wide divergence in national lines when compared with average income levels. The global poverty lines update starkly illustrates that several countries in the region are currently using standards of poverty that are modest for their income status and pace of growth.
Figure 1. National poverty lines in 2017 PPPs by country income status
Source: Joliffe, et al., 2022
For example, China has updated its national lines three times in the past four decades; yet in 2016, the national poverty line in 2017 PPP for China, an UMIC, fell significantly below the upper-middle-income line and even below the lower-middle-income line (Figure 1). Indonesia’s national poverty line in 2017 was closer to the low-income poverty line than the lower-middle line, despite its status as a LMIC. Malaysia has maintained modest national standards of poverty at the UMIC line despite being on the cusp of transition to high-income status. At the other end of the spectrum, Mongolia, a LMIC, has a poverty line that is high, closer to the benchmarks of UMIC countries.
Poverty standards matter to the role of government policies
Deciding how many are poor is not merely a counting exercise. Poverty lines that are set far too low, or too high, can both be problematic. The profile of the poor – e.g., the gender, age-distribution, ethnicity, location - depends on where the poverty threshold is set. Eligibility for social assistance programs is often determined by how many people a country considers to be poor. Government programs try to consider how far households are from meeting basic needs. The regional emphasis of anti-poverty programs within a country can change depending on where the poverty threshold is set. With economic growth and rising living standards comes an evolving concept of what it means to be poor, and thus a different set of development priorities to ensure inclusive growth.
For instance, as shown in a study of poverty in China over four decades, adopting a higher line would change the profile of the poor: more urban, more migrants, less agricultural. Based on that line, China’s poverty alleviation efforts would need to shift from the recent focus on targeting poverty eradication programs to rural households to policies that recognize these differences. In Vietnam, National Targeted Programs aim to address chronic poverty among rural, agricultural, and ethnic minority households – the “Last Mile” challenge. Yet, the share of the population that lives just above the LMIC line is more than double the size of the population that is poor. This group is also more economically diverse and spatially dispersed, requiring different strategies to attain the country’s Next Mile aspirations. Social protection systems, for one, should evolve from an emphasis on transfers to address chronic poverty to ones that rely on a mix of instruments (including insurance), and are capable of adapting targeting and delivery to address a range of risks.
In the lead up to 2019, many countries in the EAP region enjoyed rapid improvements in living standards. In dealing a historic setback to that progress, the COVID-19 pandemic has further underscored the importance—even in a largely middle-income region—of staying focused on the twin goals of reducing poverty and boosting shared prosperity.
As part of this agenda, national poverty benchmarks should be revised upwards. These will lead to a more realistic assessment of policy choices and a greater focus on those at the bottom of the income distribution.


Join the Conversation