 Poverty and inequality in Indonesia
Indonesia’s official poverty lines reveal a stagnating trend with lagging regions unable to catch up. At the same time, the poverty trends based on the international poverty lines, e.g., US$1.90 2011 Purchasing Power Parity (PPP), show a different picture: poverty reduction is progressing with lagging regions catching up. What explains these differences? As the World Bank’s Indonesia Poverty Assessment: Pathways Towards Economic Security and the remainder of this blog explain: the official poverty lines are what economists call weakly relative. They tend to increase the poverty standard from year to year. The international lines are absolute. They remain the same across years, adjusted only for changes in cost of living over time.
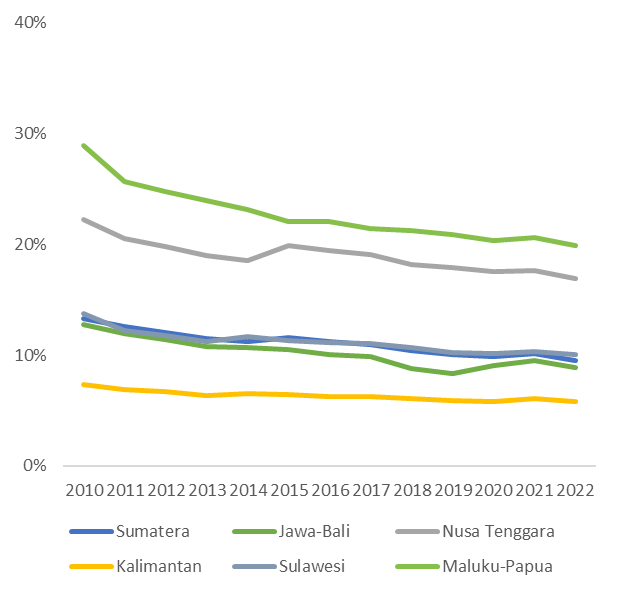
Sub-national poverty trends in poverty based on the official poverty line (left) and international poverty line at US$ 1.90 2011 PPP (right).

Indonesia’s official methodology has separate poverty lines for each province, separately for urban and rural areas. These provincial poverty lines are updated annually based on what it costs to consume 2,100 calories per day, with a small amount allocated for basic non-food items.
The cost of consuming 2,100 calories differs between households. For example, wealthier households spend more per calorie. Therefore, the methodology for setting a poverty line assumes a reference group of households, which determines the cost per calorie set based on the consumption patterns of this group. The current approach to setting Indonesia’s annual poverty lines include more and more wealthier households in this reference group year by year: the reference group for any given year is defined as the 20 percent individuals of the population, which were not poor based on the previous year’s poverty line but with food consumption closest to that poverty line. Thus, the reference group does not include any poor households. Instead, it takes a successively wealthier group of households – with a more expensive diet – year by year. In technical jargon, this creates weakly relative poverty lines, which increase with higher average living standards. This approach to updating poverty lines suppresses gains in poverty reduction, as an increasingly higher poverty line produces higher levels of poverty for constant household consumption. It is not surprising that these poverty lines produce almost stagnating poverty trends.
This methodology is applied for each urban and rural area within each province. For provinces with more rapid progress in poverty reduction, this methodology tends to increase the poverty line more. This explains the stagnant trend across provinces. It also feeds into the narrative of lagging regions unable to catch up.
Why does this matter to policy? Weakly relative poverty lines can be helpful to assess progress measured against an increasing standard of living. They include a normative component of how much the standard of living should increase year-by-year. For specific analysis, it can also be helpful to look at such weakly relative poverty estimates within provinces. However, comparisons across years need to be done carefully, keeping in mind that progress is not relative to an absolute standard. Comparisons across provinces are very hard to interpret.
To align comparisons with our intuition based on absolute standards, the World Bank developed absolute poverty lines. While World Bank’s international poverty lines also get updated from year to year, they are designed to capture only the increase in purchasing power, rather than a normative increase in the standard of living.
The international poverty line of US$1.90 2011 PPP (labeled as IPL 1.9) was equivalent to 205,741 Indonesian Rupiah (IDR) in 2010, but to IDR336,958 in 2022. However, this increase is entirely due to the decrease in purchasing power due to rising prices. If the international poverty line is expressed in constant 2011 terms (IPL 1.9 Constant 2011), it remains constant at IDR221,865 across all years. It is an absolute poverty line.
Comparison of international and official poverty lines in current and constant IDR.

In contrast, the official poverty line increases more starkly from IDR211,726 in 2010 to IDR506,847 in 2022. Expressed in constant 2011 terms, it does not stay constant but increases – though at a lower rate than the nominal change – from IDR228,310 in 2010 to IDR333,713 in 2022. Thus, the increase in current terms is only partially explained by the decrease in purchasing power, with the remaining increase driven by its weakly relative methodology.
The international poverty lines are more intuitive for comparisons across years as well as across provinces because they use an absolute standard. While weakly relative poverty lines also have their place in policy analysis, an absolute standard is used more often – or updated less frequently (for example, every 5 years). To adequately reflect Indonesia’s impressive reduction in poverty, Indonesia’s poverty lines would need to be complemented by lines using an absolute standard. Specific absolute lines for Indonesia would have the advantage of incorporating Indonesia’s own basket of consumption, rather than assuming the World Bank’s standard of US$1.90 2011 PPP.


Join the Conversation