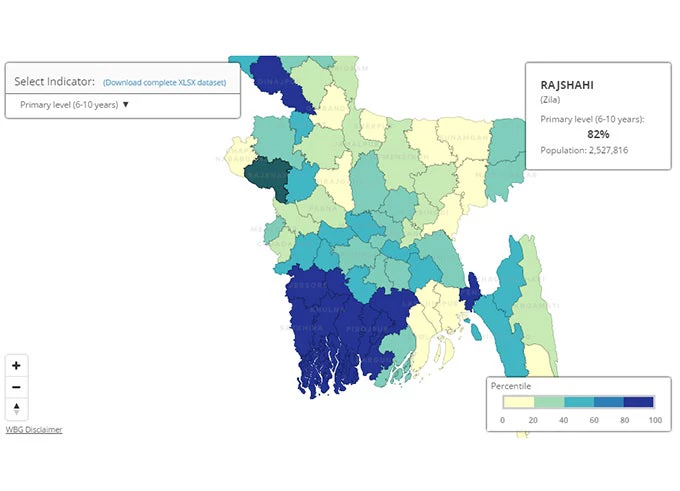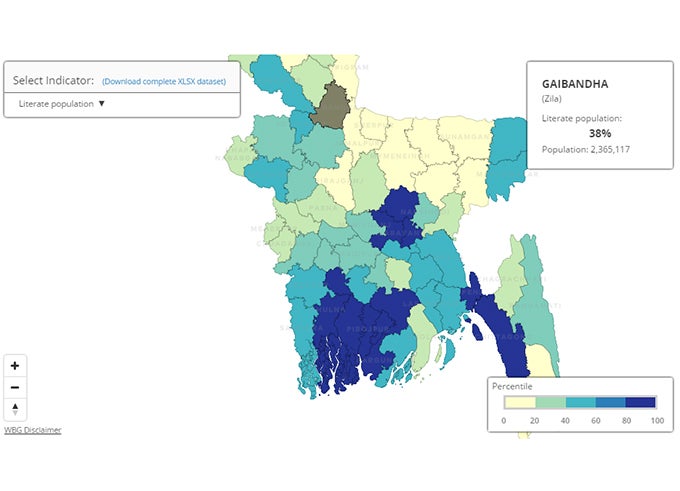
Poverty maps are a useful tool to visualize and compare poverty rates across geographic areas, and learn about how poverty is distributed within a country, which is often times masked in national or aggregated statistics. For instance, the national poverty rate in Bangladesh in 2010 was 31.5 percent, which is the latest year for which a household survey was collected by the government to produce official poverty numbers.
However, a look at zila (district) and upazila (sub-district) level poverty rates suggests that poverty levels differ quite substantially across the different areas of the country with large pockets of poverty concentrated in the north and south-west part of the country. For example, some of the zilas in the north belonging to the Rangpur and Dhaka divisions are among the poorest in the country with poverty rates well above 50 percent while some of the zilas in the south-east belonging to the Chittagong division have poverty rates well below 20 percent.
While country level poverty maps are generally widely available, accessing the underlying information is not always easy or is unavailable in a user-friendly format. Moreover, there is not a straightforward way to link these disaggregated poverty statistics with other socio-economic indicators and even if one attempts to do, it might take a substantial amount of time to put together all this information.
Specifically, poverty maps are often times disseminated in the form of printed reports, which do not allow users to directly access the data in a digitized format or link it to other socio-economic statistics. Lowering barriers to access poverty statistics and facilitating the linking of these indicators to other non-monetary living standards statistics is important to facilitate the use of poverty statistics, make them more relevant for policy and program planning, and promote more evidence-based policymaking.
To address this issue, we have developed a set of interactive poverty maps for Bangladesh which provide an online platform to access poverty, shared prosperity, and socioeconomic statistics at the national, zila and upazila levels. The indicators available through these interactive maps are organized around seven thematic areas including poverty and shared prosperity, children under-nutrition, demographics, labor markets, access to services, literacy and educational attainment, and school attendance.
Besides showcasing zila and upazila level statistics, the interactive maps report national level averages for each of the indicators and a ranking of each of the reported indicators based on the relative performance of the geographic area compared to other zilas and upazilas in the country. Lastly, all of the data underlying the interactive poverty maps can be downloaded to a user-friendly format in excel file in a single batch.

The interactive maps link monetary and non-monetary welfare indicators at disaggregated levels to provide a much richer perspective of the living conditions of the people in Bangladesh. The maps show that the non-monetary welfare indicators provide a very different picture of the living conditions than the traditional monetary poverty measures.
For instance, the stunting rates and under-weight rates among children under-five-years-old are particularly high in the east of the country, while poverty rates in these areas are relatively lower than the national average. Similarly, access to proper sanitation services in several of the zilas in Chittagong is very limited but poverty rates in these areas are among the lowest in the country.
Primary school attendance among children aged six to 10 in most of the zilas in the Khulna division is relatively high compared to the national average but poverty rates in these areas are among the highest in the country.
The Bangladesh interactive poverty maps aim to be a useful tool for policy makers and people interested in accessing poverty and socio-economic statistics at the zila and upazila levels. In addition, the maps can provide a quick glimpse of the performance of the various monetary and non-monetary indicators across the different zilas and upazilas in the country. We hope you find this resource useful and invite you to start exploring this tool.


Join the Conversation