What makes the Open India site unique?
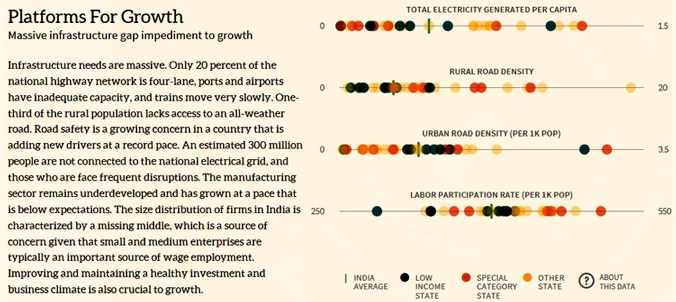
This web app takes a new and different approach in presenting the WBG's partnership strategy and current projects, by doing so in a transparent, interactive, and easy-to-use web platform. It features data visualizations that connect the main engagement areas ̶ Economic Integration, Spatial Transformation, and Social Inclusion ̶ with the underlying challenges that are being addressed through the WBG's operations and knowledge products in India. An essential component of the new Open India web app is sectoral data that quantifies India's development challenges. For example, the range of India's infrastructure and transportation gaps is presented as a data visualization below.

Source: Open India
The WBG's Development Data Group worked with the India Country Team to identify and assemble the data that would help the app users to both understand and visualize India's development challenges. Due to India's large population and land area, development indicators at the national level, which are made up of aggregates and averages, are not sufficient to understand where specific development challenges exist. We had to dig one administrative level deeper ̶ subnational data – to identify which states and territories were ahead and which were still confronting their challenges. This also coincides with the India program strategy to increase its engagement in India's 14 low-income states, which lag behind the national average across many indicators.
Where did the Development Data Group find these data?
India's official government websites have extensive data on most of the development indicators that are both published and monitored in government documents. We discovered a large part of the data from the Ministry of Statistics and Programme Implementation (MOSPI), the Planning Commission, and other sources such as the Health, Surface Transport, Agriculture, and Power ministries and departments. Data are also available in the government of India's Open Data site (data.gov.in). For some indicators on financial inclusion, we had to obtain data from private sources, such as CRISIL, an analytics and ratings firm.
Please note: data in this subnational dataset do not imply any judgment on the part of the World Bank Group concerning the legal status of the states and union territories of India, nor do they imply endorsement or acceptance of territorial boundaries.
What are the limitations of these data?
Subnational data were collected from all of India's states and union territories. Initially, close to 300 indicators were identified that addressed the three country strategy engagement areas (economic integration, spatial transformation, and social inclusion) and supported many of the priority challenges. This list was further pruned to about 94 indicators. The period covered by these data varies between indicators and topics. For instance, on census-related indicators, decade-specific data go back 11 decades to 1901. And for some of the social and urban indicators, the period covered is based on surveys conducted by MOSPI during 2000-2012.
What are some of the indicators in this dataset?
Of the 19 development challenges addressed by the WBG program in India, we currently have indicators that monitor 10 priority challenges. These are:
Social Inclusion
- Improved access to electricity in targeted states
- Strengthened public and private health delivery systems
- Improved access and quality of education
- Increased access to financial services in targeted states
- Improved transport connectivity in targeted states
- Improved demand-driven skills for productive employment
- Improved inter-regional power transmission
- Improved urban transport services
- Improved access to water supply and sanitation services
- Increased agricultural productivity in targeted areas
There are also indicators on topics such as the general economy (Gross State Domestic Product) and Poverty Head Count Ratio for each state. Metadata for these indicators were compiled from the original sources, which include indicator definitions and other data notes. The chart below shows a sampling of indicators, which includes economic, social, and infrastructure data on several (but not all) Indian states.
The values of the indicators are the most recent values/years available in the dataset. You may view other indicators in the drop-down menu.
The dataset also includes metadata – indicator definition, the source of data, general comments, and other information ̶ as shown in the example below for the indicator Net Enrolment Ratio in secondary and higher secondary education.
Net Enrolment Ratio (%)
Short definition
Enrolment in secondary and higher secondary education of the official age for that group expressed as a percentage of the corresponding population in that age group
Source
Secondary Education in India: Progress towards universalization, Flash Statistics 2012-13, National University of Educational Planning and Administration; SEMIS-FLASH-STASTICS.pdf
General comments
Net Enrolment Ratio (NER) gives a more precise measurement of the extent of participation in education of children belonging to the official school age group. The net level enrolment ratio is also used to estimate the number of children not enrolled (out of school children), by subtracting NER from 100. Theoretically, NER should not be more than 100, while Gross Enrolment Ratio can be more than 100
The subnational dataset can be accessed in two ways: first, through the Data Catalog on the WBG's Open Data site and by searching Country Partnership Strategy for India. The Data Catalog also provides metadata on the subnational dataset as well as options to access the data via an Excel download or API. Second, users can go directly to the WBG's DataBank application and select the indicators, states, and time periods in the India CPS dataset. The Open India web application also has links that redirect users to the WBG's Open Data Catalog to view and/or download the India CPS dataset.
For specific questions about the Open India site, send an e-mail to indiaexperts@worldbank.org.
Facebook: http://www.facebook.com/worldbankindia
Twitter: https://twitter.com/worldbankindia
Originally featured on the data blog


Join the Conversation