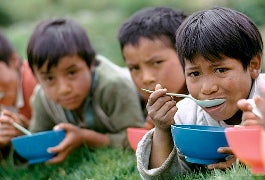
 Child malnutrition may not be apparent to parents, especially if other children in the village look the same. Similarly, it can be hard for parents to recognize when their children are doing poorly in school. And – sad, but true – badly trained health staff and teachers too often miss these things, as well. Fixing this disconnect in perceptions may be one way improve health and education outcomes.
We are testing this idea in Peru, a middle-income country with high malnutrition and poor learning outcomes. The Bank has helped define and popularize simple-to-understand standards for expected outcomes in education and nutrition. The idea is that by putting children’s development in the spotlight, we can improve decisions in the family and strengthen accountability links between service providers and parents. We got the idea from work in Ecuador, which showed that when a mother knew what malnourishment looked like, her child was less likely to become stunted).
Defining standards
The first challenge was to define a standard that parents could grasp but was also acceptable to the government technical people. We started from recognized benchmarks (such as WHO growth curves) and used focus groups to get a handle on how parents understand these things. We then worked to develop messages around height gains: that a child should grow at least 24 centimeters in his or her first year and 12 centimeters in the second year. All kids need to surpass 82 centimeters at age two; anything less is considered stunted. The ministry trained staff and community health agents in communication with parents.
Making standards relevant on the ground
Health and education systems rarely lack technical standards and norms – but often they sit in dusty manuals. Our team paid a lot of attention to making a splash and getting these reference points into the public domain. That included:
• Making hard-hitting videos to popularize standards, and show how kids in poor communities can reach them, which are broadcast daily in health post waiting rooms across Peru.
• Tracking outcomes for every child in every school and health post. For nutrition, this is done through nutritional monitoring and counseling sessions. In education the Government has set up a universal standard test to monitor reading comprehension and math skills at the end of second grade; the results are sent to every school and family.
So, has it worked? These policies have been accompanied by a sea-change in outcomes. Here are some highlights:
• The proportion of fully-proficient students in 2nd grade reading comprehension rose from 17 percent in 2007 to 23 percent in 2009.
• The proportion of fully-proficient students in 2nd grade math rose from 9.4 percent in 2007 13.5 percent in 2009.
• Nutritional monitoring increased from 3.3 controls in the first year of life in 2005 to 4.2 2009.
• Stunting rates were reduced from 28.5 percent in 2007 to 24.2 percent in 2009.
What’s next? There’s still plenty to do to get children reading at appropriate levels and reduce stunting in Peru. The government is working on the consolidation of universal monitoring systems in schools and health posts and the delivery of timely information to parents about their child’s development.
And the Bank itself needs to do more work – in Peru and beyond – to improve our understanding of the causal chains which underlie better outcomes. The improvements seen in Peru may be due to many factors working on the supply and demand side. We still need to understand better the specific contribution made by an improved awareness of standards. Two complementary mechanisms might be playing a role. One is about household behavior: improved parents’ understanding of how children should develop can inform choices about the use of household resources that can favor the children. The other is about accountability: benchmarking can strengthen understanding that communities might be getting short-changed by sub standard services, leading to pressure for better quality health and education services. Our Peru team is currently completing the analysis of a new household dataset to improve our understanding of how these factors are contributing to the improved outcomes documented above, and to establish a baseline for monitoring future improvements.
Peru Education Video
Guatemala Nutrition Video
Video to promote the use of the education evaluation results


Join the Conversation