As a reader of this blog, you are probably familiar with the discussion around the “credibility crisis” in science in general, and in economics in particular. A key problem is the lack of reproducibility standards. Not familiar? See Reproducibility and Replicability in Economics and How to Make Replication the Norm, as well as our previous blogposts here and here. Reproducing the exact results of the paper using the same data and code may seem like a low bar, but it’s one that the majority of papers do not, in practice, pass. Here, we share commons reasons papers fail, based on reproducibility checks our team has done for 55 papers. Keep reading for tips on making your papers more reproducible!
What does reproducibility mean, in practice?
Back in 2018, DIME set a reproducibility requirement: all papers must pass a reproducibility check by DIME Analytics before they can be submitted to the Policy Research Working Paper Series. Authors submit self-contained reproducibility packages, which are run at least 3 times by people not involved in the project. We check whether the results are stable, whether the code produces all tables and charts, and whether the outputs exactly match those in the paper. At the end of the process, we share a reproducibility check certificate, and a report that includes comments on the code and a list detailing the reproducibility of each exhibit.
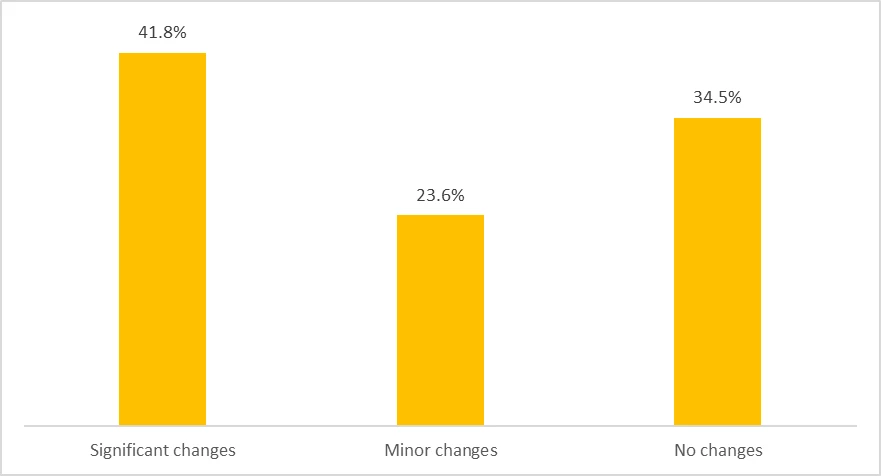
Only 1 in every 3 of the reproducibility packages we’ve reviewed were fully reproducible on first submission. Most papers required significant changes in the code (see Figure 1; NB: there were only two cases where changes impacted the paper’s conclusions). This is pretty similar to findings from broader reviews: Gertler, Galiani and Romero found that out of 203 papers published in 9 leading economics journals in May 2016, tables and figures could only be reproduced for 37%.
Three issues caused 75% of the reproducibility failures:
- Code that is not transferable from one machine to another
- Results that are not stable over repeated runs of the code
- Differences between the results we reproduce and the exhibits in the paper.
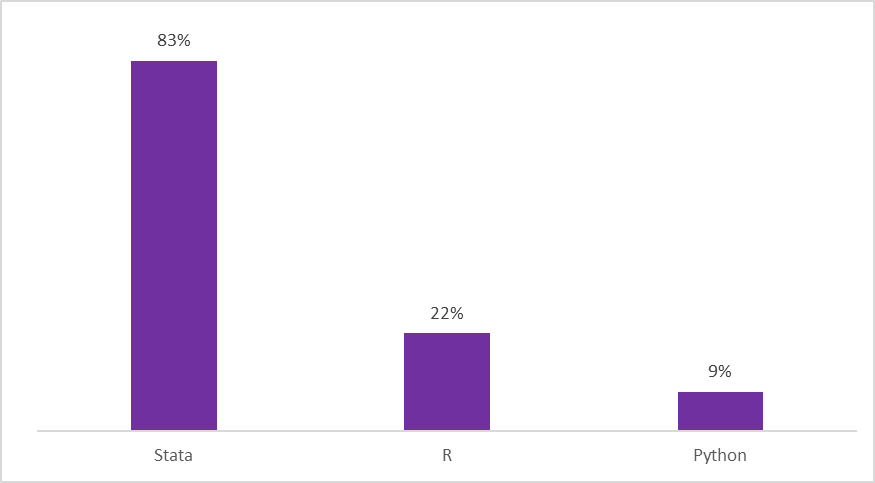
Below we explain each issue, and offer tools and tips for how to avoid it in your own work. Most of the issues have simple solutions that involve adopting good practices from the start of a project. We focus mostly on Stata, as this is the language used in most of the reproducibility packages we receive (see Figure 2).
Make code transferrable
Code is said to be “non-transferrable” if reproducibility packages run for whoever submitted them, but break for reviewers. What causes this? The most common reasons are: the reproducibility package does not include all the required code or data files; the code uses file paths that only exist in the machine where they were last run; the code requires software packages or software package versions that are not installed in the reviewers’ machine; or there are no clear instructions on what steps the reviewer should follow to recreate final results.
Tip 1: Ensure the reproducibility package is complete and file paths are not specific to your machine
Incomplete packages are common, but the solution is straightforward: check, double-check, and triple-check that all input files are included, and that the full folder structure is provided. Explicitly listing the inputs needed for each code file helps. File paths are hard to understand, and we often see them hard coded into a script (folder/that/only/exists/in/my/computer/data.dta). We also see scripts that change the working directory constantly (see Twitter rants about that here, and here). We’ve solved this by teaching research assistants how to manage file paths when they first join the team, and since then have only encountered this issue twice. While there are different solutions, we recommend using absolute and dynamic file paths (easier to implement), or a project manager (available in Stata and R) plus relative file paths.
Tip 2: If you use user-written commands, include the exact version in your reproducibility package
15% of the failures we’ve observed have been due to user-written commands that are not included or installed in the list of packages (it’s a bigger issue in R and Python, where all libraries need to be explicitly loaded). As Stata packages only need to be installed once, you may not even realize you are using a package other people may not have installed. The best solution is to include the ado files in the reproducibility package, and use sysdir set PLUS to tell Stata to look for all user-written commands inside that directory. (If you are an R user, renv is a great solution).
Tip 3: Use a master script
10% of the packages we received included multiple scripts, but no written instructions or obvious sequence. Best practice is to include a main (a.k.a master) script that sets required configurations, and runs other scripts sequentially. Good main scripts are well-commented, provide an overview of the project and analytical tasks performed, and indicate which pieces of code create which outputs. You should additionally include a proper readme file in the reproducibility package, with explanations in plain English. Refer to this great template readme file for more details.
Make code stable
70% of the failures to reproduce we’ve encountered are due to unstable random processes (often resulting in changes to the standard errors with each run). The most common reasons are: failure to set a seed, and failure to sort observations. For more about randomization in Stata, check out this DIME Wiki article.
Tip 4: Set seed before any random process (and set Stata version)
Statistical software come with a pre-defined list of pseudo-random numbers, and every time we use a command that relies on random processes, it draws numbers from it. To make the process fully random, you need to tell the computer where in this list to start drawing numbers from - by setting a seed. The seed must be an external piece of information from a truly random source (e.g. random.org, listens to radio static to create random numbers). If you don’t set a seed, the drawing may start at a different point each time the code runs, causing results that depend on this process to change. Further, the algorithm used by Stata to generate random numbers may also change from one version of Stata to another, so setting a seed is not enough to make sure you are drawing the same numbers; you must also set the Stata version at the start of your code (our command ieboilstart does exactly that). PS: this applies to fixed-effects too, which may matter if you are reporting coefficients from say, an event study …
Tip 5: Explicitly sort observations
Stata often changes the order of observations without an explicit command from the user. This happens with commands that are frequently used, such as duplicates and merge, and setting a seed will not stabilize the sorting they produce. Since the order of observations is likely to affect the output of other commands that depend on random processes, the observations they are running on must always have the same order. Sorting observations uniquely using a proper ID variable before you use these commands will address any unstable sorting that might go unnoticed in your code.
Export outputs reproducibly
20% of the failures we’ve observed came from workflows that include manual steps. For example: manually copying results from the console to the paper; manually editing tables or graphs after export; or manually hard-coding values in tables. When this happens, reviewers are simply not able to verify reproducibility (it also frequently results in papers that are published with out-of-date exhibits).
Tip 6: Automate process of exporting outputs, and of including them in the paper
Stata’s built-in graph export command does the first part well. This blogpost discusses two alternative user-written packages to export tables and a suggested workflow to create them. In either case, outputs should be saved in formats that are not specific to the statistical software you are using (and preferably also git-tracked), such as .png for images and .csv or .tex for tables. Exporting, however, is only half of the battle: you still need to add the outputs into the manuscript, and keep them updated. The most advanced way to do this is to create dynamic documents from Stata: we recommend markstat (our training is linked here), but the built-in command dyndoc achieves the same goal. LaTeX, more familiar to an academic audience, is similarly effective. Unfortunately, there is no fail-proof, reproducible way of doing this in Microsoft Office, though linking images files and Excel spreadsheets rather than simply inserting them may work in some contexts.
Conclusion
We hope these tips will make it a little easier for you to improve reproducibility for your own research. Adopting better workflows now will save you time troubleshooting at the publication stage, when you’d rather be polishing the paper instead of fussing over Stata code. Those of you familiar with git can follow our hands-on demo, which walks through the process of testing the reproducibility of reproducibility packages before submitting them.


 San Martin")

Join the Conversation