
Image Source: Wikimedia Commons
Time travel is, of course, the stuff of science fiction. H. G. Wells wrote about it in 1895, and it’s been fertile territory for film and television makers ever since. But the ability to store and retrieve digital records has at least made it possible to travel back in time with data...
For users of statistics, it turns out this can be a pretty handy thing to do: estimates and measures of many indicators get revised as methods improve, and as geographies and economies shift over time. A statistical data Time Machine can help answer questions like how much estimates been revised - and even whether different decisions might have been taken with the benefit of hindsight.
Now, 2015 is the year of the Data Revolution. So, let’s make a contribution by making a Time Machine using World Bank open data. We're pleased to announce that the World Development Indicators Database Archives are now available in the DataBank Application, read more below on how we got here!
Time Machine Version 1: a big bookshelf
Until fairly recently, the only Time Machine option was to use printed data tables in paper publications, like the World Development Indicators (WDI). Here’s my own primitive version: my bookshelf - this takes me back to 1997, and, if I look a bit harder, I can even get back to 1978 (when World Development Indicators was first published) or 1966 (when the World Bank published the very first World Bank Atlas.)
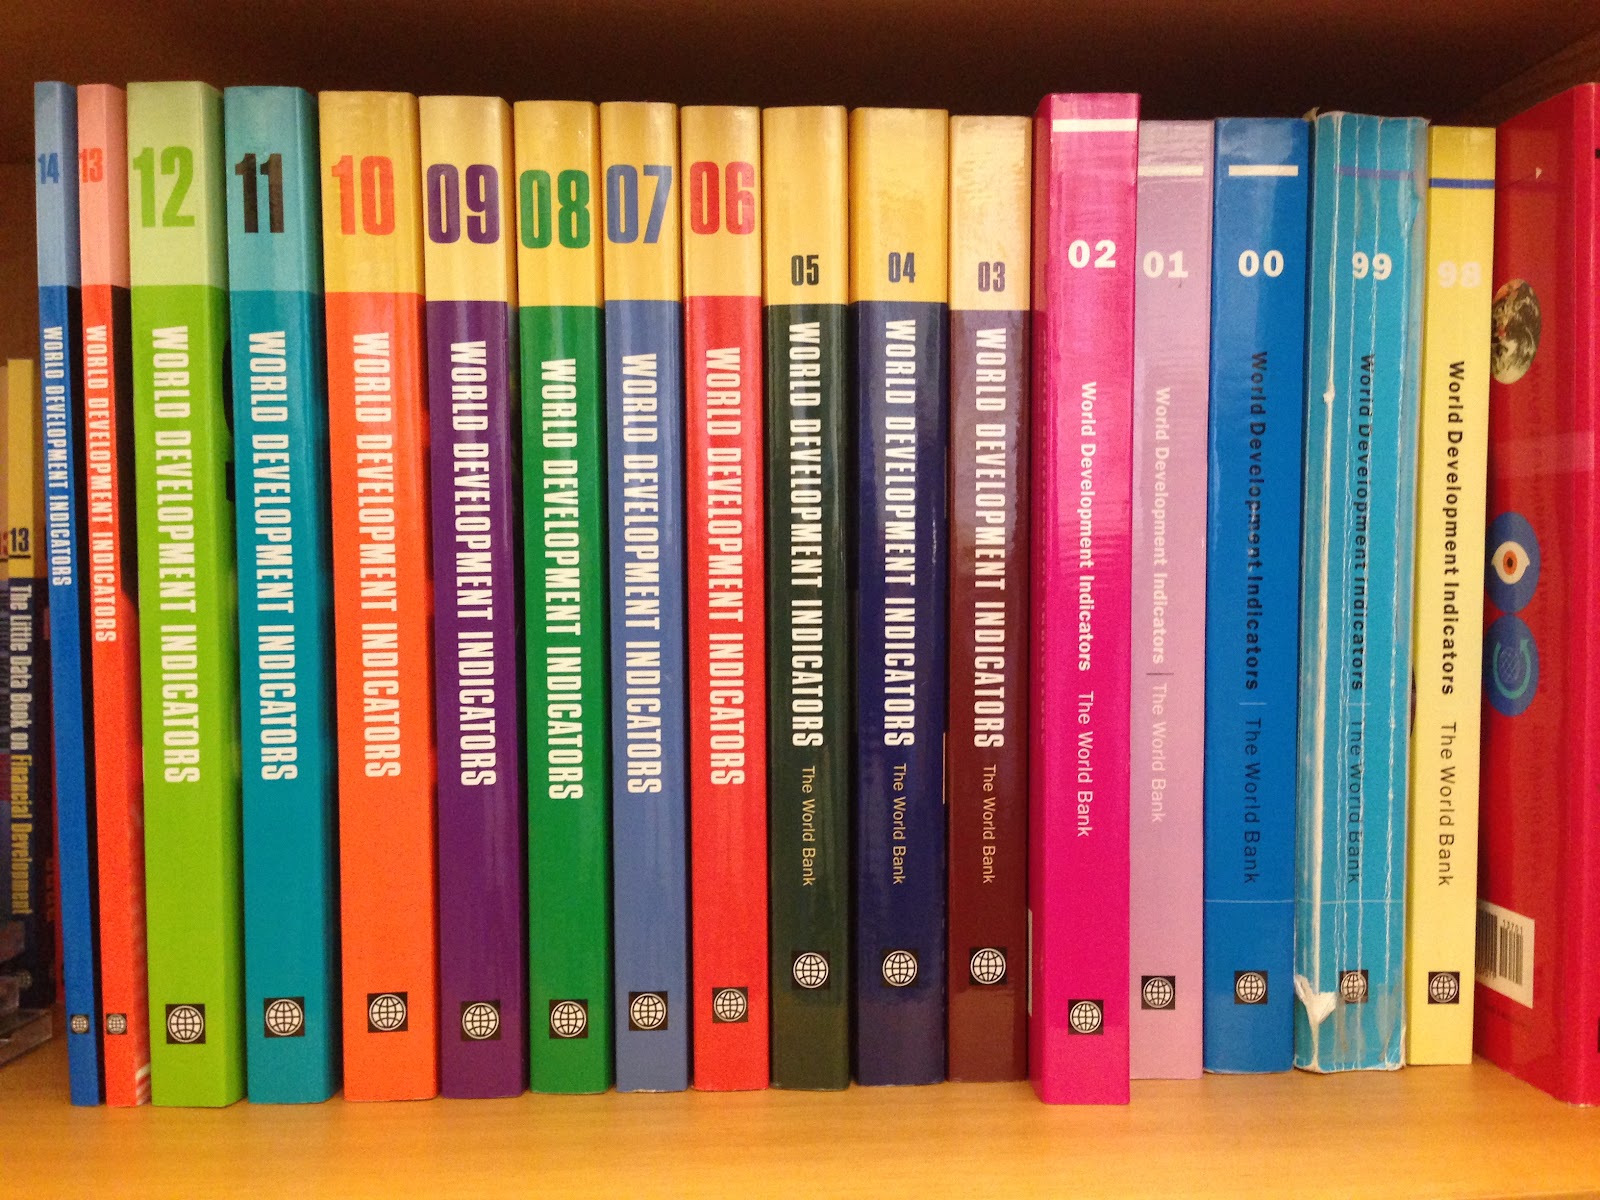
Now this may not look like a proper Time Machine (I mean, where are the flashing lights?), but it does have one big advantage: it’s very easy to use. But it has a few pretty serious weaknesses: for instance, it’s hard to extract the time-series data: the 1999 edition contains tables which gives the latest estimates for 1997; the 2000 version has estimates for 1998; and so-on. But what if the estimates for 1997 were revised in the meantime? And, of course, you need a big bookshelf.
Time Machine Version 2: downloadable database snapshots
So a few years back we started to make historical versions of the WDI database available online, at the main WDI page:
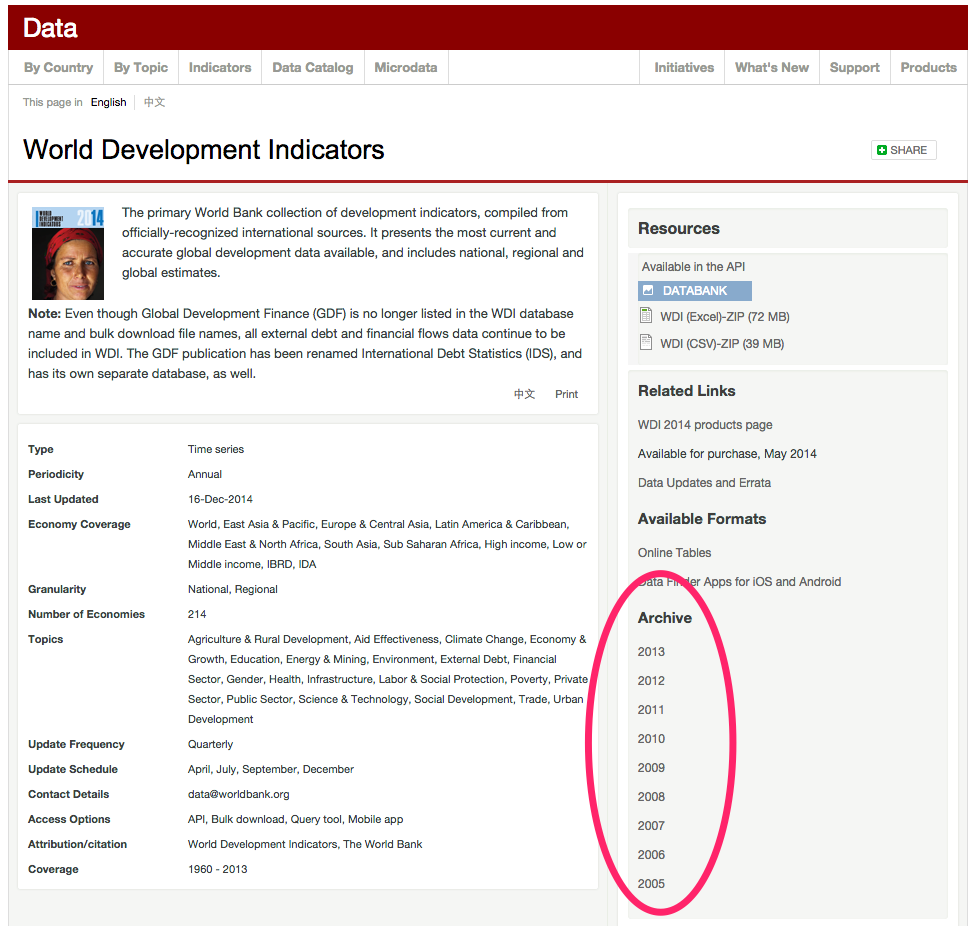
This Time Machine is much better than the bookshelf version (still no flashy lights, though): each database has all published time-series, based on the latest available estimates at the time of publication. And the database contains some metadata - or notes - about the database and the series. But some versions of the database are in proprietary formats, like Microsoft Access or Excel. And suppose you want to see the history of revisions to certain series, like population or GDP? Since each database is a snapshot at a point in time, you’re going to have to do some clever dataset manipulation to combine everything together, and that’s kind of tricky and error-prone. Unless you happen to be into that sort of thing, of course.
Time Machine Version 3: a query tool with selectable data revisions
Inspired by others, and especially the work of the team behind the FRED and ALFRED databases at the St Louis Federal Reserve, we’ve been working on improving this by constructing our own proper data archive (by the way, if you haven’t seen ALFRED before, do so now - as some folk seem to have figured out, I’m a pretty big fan!) You can now access the World Development Indicators Database Archives via the DataBank applicaiton.

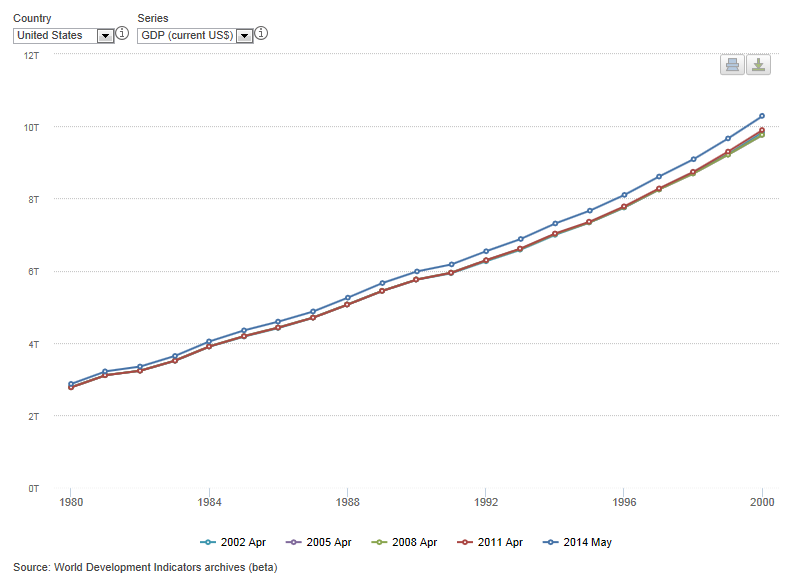
Here’s how one query looks: I’ve selected the United States GDP time series (in dollars) between 1980 and 2000, from five archived databases: those published April 2002, 2005, 2008, 2011, and 2014. The first four databases all had very similar values - small revisions between each database update. But the 2014 database update revised the series considerably. Why? Because the U.S. introduced the latest national accounting standards in 2013.
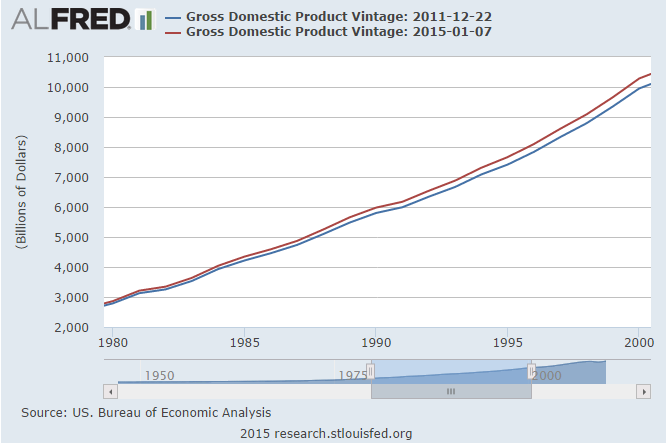
Incidentally, here’s how a similar query (just using two vintages of US GDP, current and 2011) looks in ALFRED:
Anyway, we’ve done our best to combine all the archived versions of the WDI into one “archive” database (the WDI Database Archives, or WDI-DA for short), and we’ve made this available today as a “beta” test release to users through the DataBank application. Typically, in the DataBank, you select a country and series combination to view the time series (Malawi’s GDP, for example). With the archive version, WDI-DA, you’ll also select the database version - the latest version will give you the most recent (and therefore, we hope, the most accurate) estimates - currently, that version would be December 2014. But you’ll also now be able to add estimates for any of the previous versions to your query. No more searching through pages and pages of previous books (unless you’re one of those who still like the feel of real paper). And no need, any more, to download all those copies of the database.
What would you like to see in an open data time machine and API?
We know that this new “Time Machine” is not going to be for everybody; it’s aimed at a relatively small group of specialized users. We know, too, that there is a lot more to do: we’d like to add the “version” dimension to the API, for instance, and include the notes and metadata that accompany each archive. We know that there might still be some inconsistencies in the naming and coding conventions over time, though we’ve been fixing what we can: we’ll talk in more detail about this in a later blog. We know that the old databases don’t have the same level of metadata - and frankly it’s been difficult to put the metadata into the database correctly (right now, we’ve just included the metadata from the latest version). And we know that the database might raise many more questions than we will always have answers for - especially those of the “why did you revise these numbers” variety....
So please bear with us: that series in the chart above is just one of the roughly 220,000 we update each quarter. And so tracking the reason behind every revision that has occurred over the 50 or so database updates in last 25 years is, well, you know, tricky. Still, don’t let that stop you asking questions: it would be really helpful to know where we should focus our effort.
As I mentioned at the start of this blog, one use case for archives like this is to find out what data was available for decision-making at the time, compared to what we now know: the “hindsight” factor. We’re also using the archive databases ourselves for quality control and consistency checking purposes. And we might also be able to use them for better understanding the accuracy of some of the estimates. Will you use these archives - and, if so, how? Let us know in the comments below, via our Helpdesk or on Twitter to @worldbankdata.

Join the Conversation