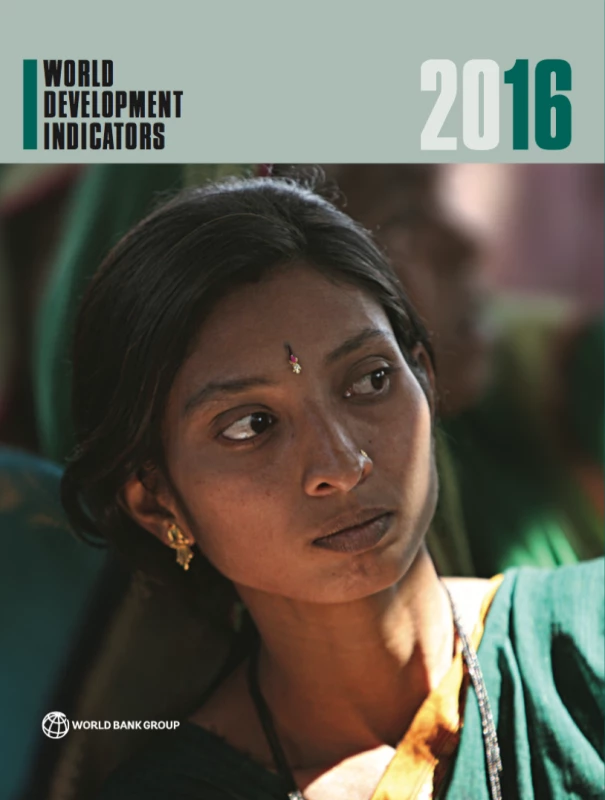
We’re excited to announce the release of the 2016 edition of World Development Indicators (WDI).
With over 1 million downloads last year, WDI is the most widely used dataset in our Open Data Catalog and it provides high-quality cross-country comparable statistics about development and people’s lives around the globe. You can:
- Download the full publication (PDF: 7Mb) & highlights featuring the SDGs (PDF: 6Mb)
- Download or query the database
- Access the statistical tables
- Browse the full list of WDI products
WDI now includes 1,400 indicators for over 200 economies. While we update the WDI database quarterly and make historical versions available, this annual release of a new edition is an opportunity to review the trends we’re seeing in global development and discuss updates we’ve made to our data and methods.
We’ve gone from the MDGs to the SDGs with expanded data and illustrations of trends
The WDI team aims to produce a curated set of indicators relevant to the changing needs of the development community. The new edition includes indicators to help measure the 169 targets of the 17 Sustainable Development Goals (SDGs) - these build on the 8 goals and 18 targets of the Millennium Development Goals we focused on in previous editions, but are far wider in scope and far more ambitious. A complementary Sustainable Development Goals data dashboard provides an interactive presentation of the indicators we have in the WDI database that are related to each goal.
For each of the 17 SDGs the World View section of the publication includes recent trends and baselines against key targets. Data experts in the World Bank’s Data Group and subject specialists in the Bank’s Global Practices and Cross Cutting Solution Areas teamed up to identify new and existing indicators and assess key trends for each goal and for three cross-cutting areas: statistical capacity; fragility, conflict and violence; and financial inclusion.
A series of blogs will look further at data and the SDGs, and review some of the measurement challenges. To give you an idea of how interesting some of the trends are, here are four charts we found striking:
 |
 |
|---|---|
| While undernourishment has been halved globally since 1990, over a quarter of the population in low-income countries still can’t meet their dietary energy requirements. |
Good records of births and deaths are key to delivering government programs and services, but in Sub-Saharan africa, fewer than half of children’s births were recorded in 2011. |
 |
 |
| While some regions have increased forest coverage, Latin America and the Caribbean and Sub-Saharan Africa lost 97 and 83 million hectares respectively since 1990. |
Since the 1980s there has been a dramatic rise in aquaculture - fish, shellfish, and seaweed farming. We now farm as much fish as we catch. (The resemblance between this chart and the shape of a fish is pleasing, but coincidental!) |
Download the World Development Indicators from the Bank's Open Knowledge Repository
We’re no longer distinguishing between “developing” and “developed” countries
Last November, Tariq Khokhar and Umar Serajuddin asked the question: “Should we continue to use the term ‘developing world?” The conclusion was that it’s becoming less relevant, and with the focus of the SDGs on goals for the whole world, we should start phasing out the term “developing world” in our data publications and databases.
Therefore, In WDI 2016, there is no longer a distinction between developing countries (defined in previous editions as low- and middle-income countries) and developed countries (previously high-income countries). Regional groupings (such as “East Asia”) are now based on geographical coverage rather than a sub-set of countries that were previously referred to as developing. In some occasional cases, where data availability or context have dictated it, we’ve excluded high income from some charts or tables, and we’ve indicated that in the footnotes.
Two implications of this change are that a new aggregate for North America has been included in tables, and aggregates for Europe and Central Asia include countries of the European Union. Since we know there is still demand for this from some users, global aggregates that exclude high income economies are still available in the database.
We’ve included the new $1.90/day extreme poverty line and data based on 2011 PPPs
WDI 2016 now includes the estimates of global and national extreme poverty rates at the international poverty line of $1.90 a day per person, in 2011 purchasing power parity (PPP) terms, as reported by PovcalNet and first published in the 2015 Global Monitoring Report. These show that 13 percent of the global population lived in extreme poverty in 2012, down from 37 percent in 1990. WDI also includes the estimates of indicators of shared prosperity for 94 countries published in the Bank’s Shared Prosperity database, including the growth rates of the average income of the bottom 40 percent.
In addition to poverty measurement, the updated 2011 benchmark PPP data have been used to estimate PPP conversion factors for 2014, and 2014 estimates of GDP in PPP terms. These estimates show that the world’s five largest economies are China, United States, India, Japan and Germany.
The WDI is part of a global effort to produce a global public good

A selection of WDI partners, see the publication for a complete list of acknowledgements.
Producing WDI is only possible with the help of over 50 international organizations, more than 200 national statistical offices and the experts in the country offices, Global Practices and Cross Cutting Solution Areas of the World Bank.
But we have a global challenge: Only a few of the 169 targets in the SDGs can currently be tracked and measured completely . Both governments and development partners will need to continue investing in national statistical systems and other public institutions, where much of the data will continue to originate. At the same time, the statistical community needs to strengthen partnerships with the private sector and other emerging actors for advancing new techniques for data collection, analysis, and use.
We look forward to sharing more of our work in this area, including through the Global Partnership for Sustainable Development Data - if you’re interested in collaborating, please get in touch.
Accessing the data
All the data in World Development Indicators is available completely free of charge, as part of the World Bank’s Open Data Initiative. A complete list of tools to access, explore, and interact with WDI 2016 are available at http://data.worldbank.org/wdi and include:
- The World Bank’s main multi-lingual data website, http://data.worldbank.org and a new “beta” website, optimized for mobile devices: http://beta.data.worldbank.org/
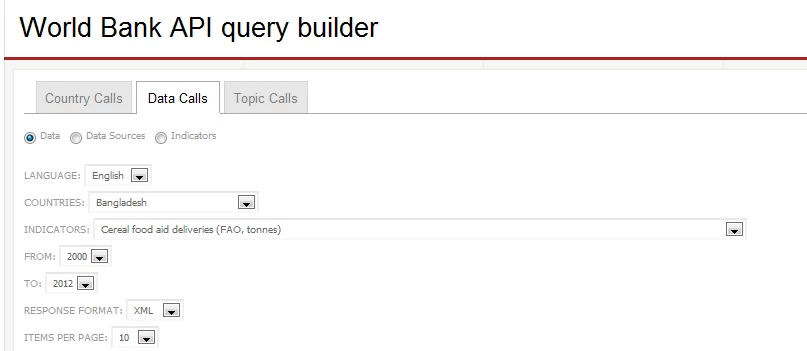
- Bulk download files of the WDI dataset in CSV and XLS formats, direct access via our API and via third party API wrappers for popular languages including Python, STATA and R.
- The World Development Indicators and Little Data Book print publications in PDF and eBook formats: http://data.worldbank.org/wdi
- The DataBank query tool which allows users to create, save, and share tables, charts and maps, and embed them on webpages: http://databank.worldbank.org
- Statistical tables and metadata for countries, geographic regions and income groups presented by WDI section: http://wdi.worldbank.org/tables
- The DataFinder mobile apps for for iOS and Android devices: http://data.worldbank.org/apps
- The Data Helpdesk which responds to frequently asked questions about World Bank data and lets users submit new questions: https://datahelpdesk.worldbank.org/
You can follow all the blogs related to the WDI here on The Data Blog and keep up to date with our latest news via @worldbankdata on Twitter.


Join the Conversation