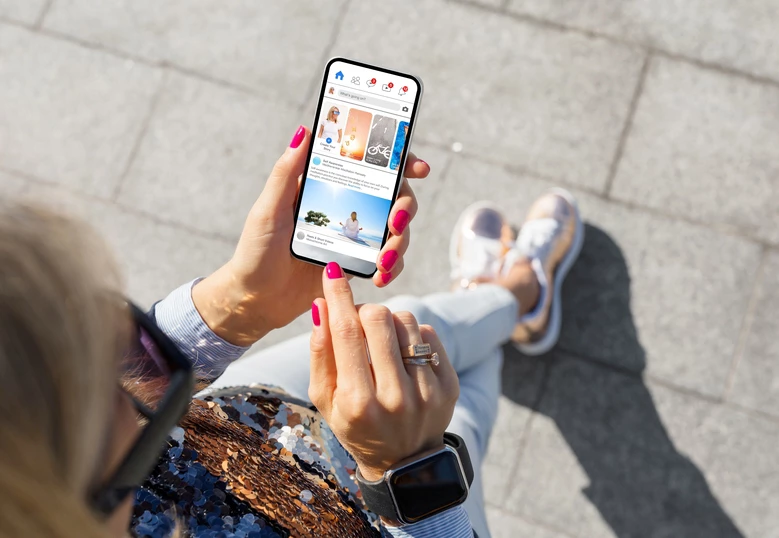
 Woman using social media. Photo: Shutterstock
Increasingly, big, private sector data sources have been leveraged to nowcast economic and social indicators. Data from Yelp can predict changes in the number of businesses and restaurants. Google search data have been used in a variety of contexts, such as estimating GDP, unemployment, and COVID-19 cases. X (formerly Twitter) data have been used to estimate earthquake damages in real-time, forecast influenza, among other applications.
These sources can be used to complement surveys and administrative data—for example, to provide real-time indicators that are only available periodically from surveys, or to provide more granular data than is available via official sources.
Facebook marketing data in social science research
In a new paper, we use data across 59 countries to show that anonymized Facebook marketing data (among other data sources) can support estimating poverty. The Facebook Marketing API allows querying the number of daily and monthly active Facebook users (DAU and MAU) according to a variety of characteristics for any given location (down to 1 kilometer).
In a 2020 paper, Fatehkia et al. originally tested the use of Facebook Marketing data for poverty estimation in the Philippines and India and found that characteristics such as the proportion of Facebook users connecting to Facebook via a high-end phone correlated with an asset-based wealth index.
We expand Fatehkia et al.’s approach, querying Facebook marketing data for 63,854 survey cluster locations from Demographic and Health Surveys (DHS). We compare an asset-based wealth index captured in DHS data with over 30 indicators from the Facebook Marketing API. We find that—across countries—characteristics such as the proportion of Facebook users interested in restaurants, the proportion determined to be frequent international travelers, and (similar to Fatehkia et al.) the proportion that connect to Facebook via a high-end device are all positively associated with wealth. Figure 1 shows scatter plots comparing the proportion of Facebook users interested in restaurants and the wealth index for select countries.
Figure 1. Comparing the proportion of Facebook monthly active users interested in restaurants and the DHS wealth index. The top 20 countries with the highest correlation are shown. Survey clusters where Facebook records fewer than 1000 monthly active users—where Facebook does not provide an exact number of monthly active users—are removed.

In addition to poverty estimation, the Facebook Marketing API has been used for a number of other social science applications, such as disease surveillance, monitoring refugee and migrant flows, creating indicators of gender inequality, and estimating the number of migrants in the United States.
rsocialwatcher R Package
To facilitate researchers in using the Facebook Marketing API for social science applications, we developed the rsocialwatcher R package. This package was inspired by an existing Python package—pySocialWatcher—that facilitates querying the Facebook Marketing API using Python. With both a Python and parallel R package, we hope querying the Facebook Marketing API will be more accessible to even more social science researchers.
Below we illustrate using the package to understand how Facebook usage relates to internet connectivity and per capita GDP in Sub-Saharan Africa—as well as how Facebook data can be used to examine the gender digital divide. First, we query data from the World Development Indicators and from Facebook as shown in the below code (code for cleaning the data and producing the below figures can be found here):
We divide Facebook monthly active users with population from WDI to determine the percent of the population on Facebook. We find that Facebook penetration is generally low—less than 25% of the population are Facebook users across most Sub-Saharan African countries, but a couple countries see high Facebook usage (panel A, below). Panels B and C show that the percent of the population on Facebook is correlated with internet connectivity and per capita GDP.
Figure 2. Percent of the population on Facebook across Sub-Saharan African countries (panel A) and association of the percent of the population on Facebook with internet connectivity (panel B) and GDP (panel C).

Next, we use the data to understand the gender digital divide. We compare the percent of females in the population with the percent of females among Facebook users. As expected, across countries about 50% of the population is female—but most countries see a much lower percentage of Facebook users that are females (panel A, below). Panel B shows that countries with a higher share of female Facebook users tend to be richer.
Figure 3. Association between the percent of Facebook users that are female with the percent of females in the population, across all Sub-Saharan African countries (panel A) and across Sub-Saharan African countries by income group (panel B).

The package facilitates making queries across many types of parameters, such as users with specific interests, behaviors, amount of education, occupation, age, gender, among other characteristics. Queries can be made at different geographic levels, such as countries, regions, cities, neighborhoods, and around a specific coordinate. Moreover, the package facilitates making complex queries—such as querying the number of users interested in (1) travel or (2) tourism, but (3) are not determined to be frequent travelers. The package documentation provides a number of examples illustrating the use of the package.
Acknowledgements
This work received funding from the ieConnect for Impact program which is a collaboration between the World Bank’s DIME group and the Transport Global Practice. The ieConnect program has been funded with UK aid from the UK Government.


Join the Conversation