SDG 13 calls for urgent action to combat climate change and its impacts.
Scientists and policymakers have set a goal of limiting global warming to 1.5°C above pre-industrial levels. Today, the planet is only 0.4°C from that mark.
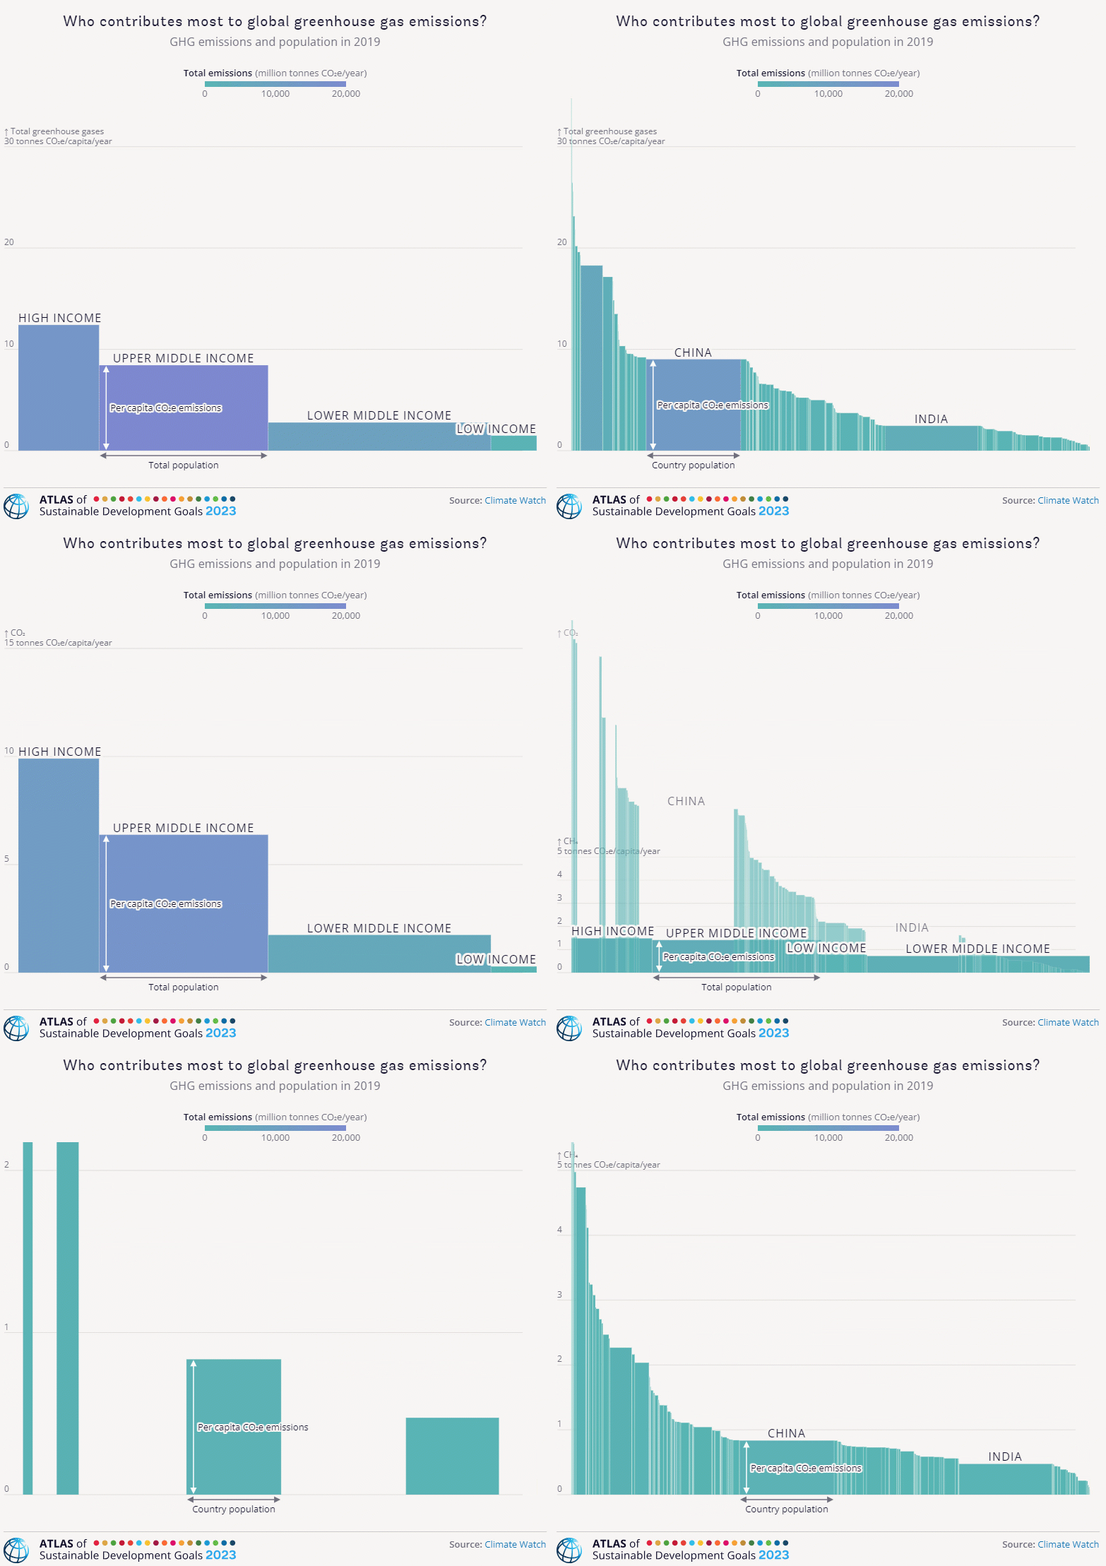
Total greenhouse gas emissions in 2019 were 48 million CO₂ equivalent tonnes (tCO₂e) with a wide variation across countries. Countries with a higher population and countries with higher income levels tend to emit more. On average, each person accounts for 6.2 tonnes of CO₂ equivalent emissions. But in many countries, the number is three times greater.
A number of greenhouse gases contribute to this warming, among which carbon dioxide (CO₂) is the most important because once produced, it stays in the atmosphere for thousands of years.

As visualized in this interactive chart of the 2023 Atlas of Sustainable Development Goals, in 2019, of all the greenhouse gases, CO₂ emissions were largest, reaching 35.5 billion metric tonnes. The difference in CO₂ emissions among income groups is stark. Emissions per capita in high-income countries was twice (9.9 tCO₂e) the global average (4.6 tCO₂e), whereas, in lower-middle-income countries, it was less than half (1.7 tCO₂e) and in low-income countries it was one-fifteenth (0.3 tCO₂e) of the global rate.
The largest contributors to current CO₂ concentrations are China (30 percent) and the United States (nearly 14 percent). However, the US and China are ranked 10th and 29th in terms of CO₂ emissions per capita. The largest emitters of CO₂ per capita are oil-rich countries such as Qatar, Bahrain, and Kuwait.
Since methane is emitted largely from agricultural activities and this sector is important in low- and middle-income countries, the differences in methane emissions between income groups are smaller. Methane emissions per capita range from nearly 0.8 tCO₂e in lower-middle-income countries to 1.5 tCO₂e in high-income countries.
China, the United States, Russia, and India are among the largest contributors to methane emissions. However, Turkmenistan has among the highest methane emissions per capita with a large amount from fugitive emissions.
Countries with large livestock populations such as New Zealand and important agricultural producers like Mongolia are also among the top 10 methane emitters in per capita terms.
To learn more about climate change and its impacts, look at the data stories and visualizations of the thirteenth story of the Atlas.


Join the Conversation