
The objective of the Global Program on Sustainability (GPS) Technical Assistance Grant for the Mexico Connecting Watershed Health with Sustainable Livestock and Agroforestry Production Project (CONECTA, P172079), financed by the Global Environment Facility (GEF), is to strengthen integrated landscape management (ILM) in priority watersheds in Mexico with biophysical evaluation and economic valuation of ecosystem services to boost sustainable, inclusive rural livelihoods and promote climate-smart productive practices. The Grant is expected to provide analytical underpinnings for land use planning under Component 1 and subprojects focused on conservation and restoration under Component 3 of CONECTA. For example, one of the CONECTA targets is to restore 10,500 hectares of degraded land across the 15 targeted watersheds.
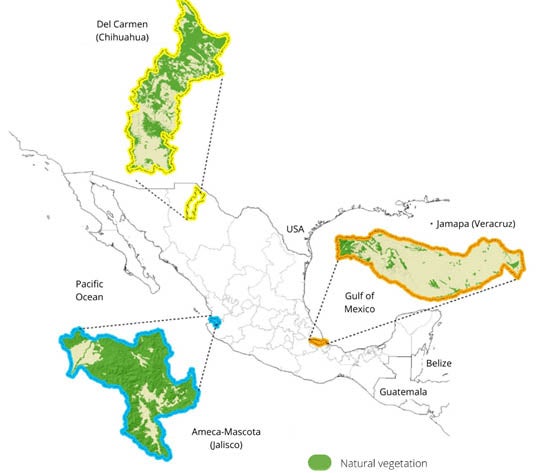
The GPS study focused on three carefully selected CONECTA watersheds across different ecoregions in the states of Chihuahua, Jalisco, and Veracruz (see Figure 1). The deforestation percentage in each watershed is similar, but the land size and amount of existing natural vegetation, among other variables, are quite different. By applying local layers of analysis, the team was able to refine datasets to significantly improve the baseline delineation, allowing a more accurate evaluation of benefits for the proposed CONECTA actions for vegetation recovery.
As the team began choosing plots for restoration, refining the collected data became important. Natural vegetation trends were previously analyzed with layers at the national level. These maps were not detailed enough for the necessary analysis because small patches of vegetation could not be identified. An omission of remanent vegetation could mean a less accurate evaluation of benefits, the implementation of measures that could affect those patches, decreased landscape connectivity, and missed opportunities for more significant results with less investment, such as the creation of biological corridors. Consequently, it was important to determine the natural vegetation at a smaller scale as a baseline reference for targeted actions like live fences, scattered trees in grasslands, and riparian vegetation recovery.
In the case of two of the three watersheds (Ameca and Jamapa), priority areas for the project actions focus on the primary productive sector previously determined by the National Institute of Ecology and Climate Change (INECC) with layers available at the national scale. But the scale did not allow identification of the remaining vegetation in highly fragmented landscapes. With refined analysis, the team could focus on smaller areas needing restoration after determining that almost 20% of the priority area of Ameca and more than 40% of the priority area of Jamapa were already forested and were excluded from further analysis.
With those conservation areas set aside, the team identified priority restoration areas. The next step was to develop a scenario exploring plausible future benefits of proposed climate-smart actions in favor of landscape connectivity, reduced deforestation trends, and increased carbon sequestration. The benefits of restoration actions could be evaluated under two perspectives (see Figure 2):
- Assume activities affect the entire property, so the whole area is considered a contribution to the project targets.
- Assume a more demanding approach by only including the landscape directly occupied by the action, such as the outer edge of an area in the case of live fences.
For example, in a 1-hectare implementation area:
- The first perspective recognizes the contribution of the action (live fences, riparian vegetation, and isolated trees) on the whole property: 1 hectare added to the watershed restoration target.
- The second perspective exclusively accounts for the area occupied by the action: only the fraction of space occupied by the live fences is reported against the restoration target.

How does this analysis improve decision-making?
CONECTA has several goals to promote ILM. With the first perspective, it is easier to reach the target of the intervened surface. Still, there is a lower percentage of direct intervention in terms of landscape connectivity and recovery of ecosystem services. In contrast, in the second perspective, a high participation rate by landowners is necessary to reach the target surface. Also, a higher proportion of the watershed gets directly intervened, increasing landscape representativeness.
Further, when considering the two perspectives in the climate-smart scenario compared with the BAU scenario over time, the connectivity trends are higher under perspective 2. Under both perspectives, connectivity across the landscape increases, even if deforestation trends continue. However, carbon sequestration decreases even in the most promising perspective (Figure 3). In this case, carbon sequestration techniques, such as using native species with high carbon sequestration potential, can act as an offset.

Nowadays, free satellite imagery with high spatial and temporal resolution is available worldwide, allowing more detailed land use and vegetation maps. Although creating these products requires an investment in technical assessment, the detailed information leads to more precise baseline scenarios, avoids investing in areas with negligible benefits, and helps identify sites where specific actions could positively impact the landscape as recovering a fragmented biological corridor. Also, recognizing the pros and cons of different ways of evaluating the expected benefits of a project could facilitate decision-making for focusing possible scarce resources to obtain maximum benefits.


Join the Conversation