As we approach the third year of the COVID-19 crisis, we deepen our understanding of the pandemic’s impact on poverty and inequality across the globe. One of the many changes prompted by COVID was in the way which we collect data. Conducting household surveys—our main method of data collection before the pandemic—was suddenly not possible in most developing countries, due to social distancing requirements. High Frequency Phone Surveys (HFPSs), conducted by the World Bank in collaboration with national statistical offices, filled the void. These surveys are leaner than the regular household surveys in format and scope, but they provide a window that enables us to analyze the changes in household welfare when other sources of data are unavailable.
The newly published Global Economic Prospects report (see Chapter 4 here, chapter highlights here, and the charts here) and an associated background paper utilize the HFPSs to estimate the impact of COVID on poverty and inequality in 34 countries spread across five geographical regions.[1] This blog contains a summary of those estimates.
The phone surveys reveal the share of households that have lost, gained, or had no change in their income since the start of the pandemic. It is not possible to know through HFPSs the households’ position in the income distribution, but we can use information about household characteristics—such as demographics, educational attainment, and rural or urban residence—available through HFPSs in addition to the latest household survey in the country to try to map the probability that a household experienced an income loss in 2020. This helps us understand whether the top or bottom of the distribution was more likely to lose income in that year.
We compared the losses for two groups: the bottom 40 percent and the top 60 percent of the income distribution for each country. Figure 1 shows the difference in probability of losses between the two groups for rural, urban, and national areas.
A positive estimate suggests that the bottom two quintiles were more likely to lose income than the top three quintiles. For rural households, the losses were mixed—in 12 countries the top 60 percent had a greater probability of experiencing income losses compared to 20 countries that had higher probability of losses for the bottom 40 percent. For urban households, the losses were predominantly larger for the bottom 40 percent—29 out of 34 countries reported higher losses for the bottom 40 percent compared to the top 60 percent. The analysis indicates that the pandemic was particularly hard on poor urban households and may have increased inequality in urban areas.
Figure 1: Share of households with income losses during 2020, bottom 40% minus top 60%
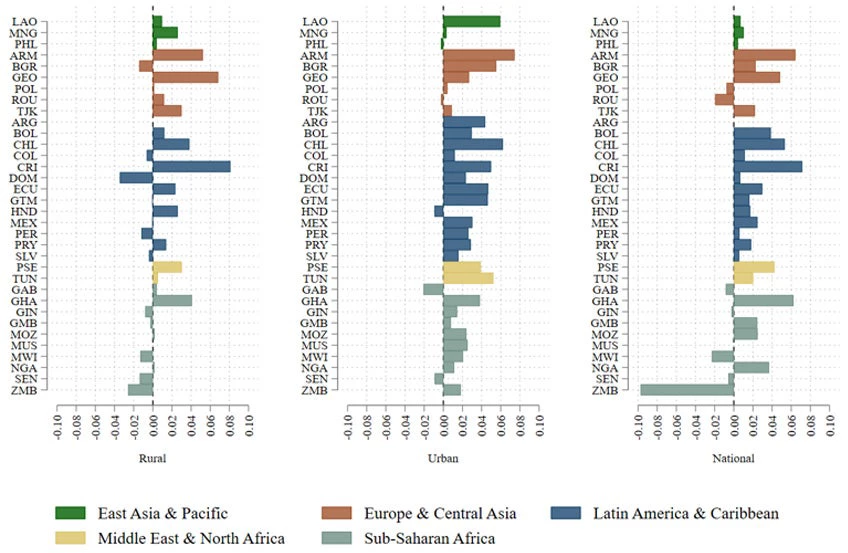
Source: Authors’ calculation based on High Frequency Phone Surveys.
The phone surveys don’t capture the size of these income losses, but by distributing countries’ sectoral GDP growth to urban and rural households using the information from Figure 1 and some further assumptions discussed in the background paper, we can calculate poverty and inequality in 2020.
We find that extreme poverty increased in 2020 for all countries (Figure 2). The expected changes in extreme poverty without COVID-19 are presented in the left panel and the simulated changes due to the pandemic are shown in the center panel. The right panel shows the net effect of the pandemic—or the sum of those who would have moved out of extreme poverty in 2020 had the pandemic not happened and those who moved into extreme poverty in 2020 compared to 2019 due to the pandemic. On average, the COVID-19-induced extreme poverty is set to increase by 0.9 percentage points in the 34 countries, and by 1.3 percentage points if we only consider the countries in Sub-Saharan Africa.
Figure 2: COVID-19-induced changes in extreme poverty
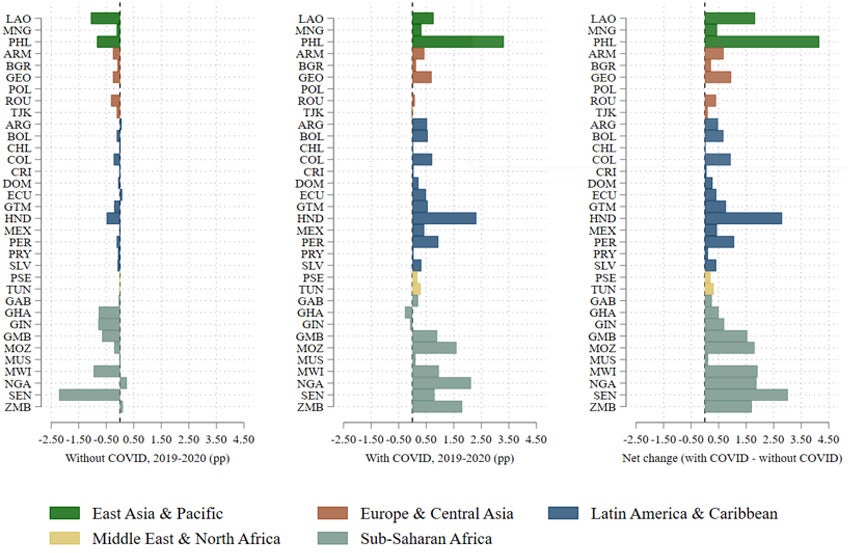
Source: Authors’ calculation based on High Frequency Phone Surveys.
While there were large increases in poverty in most countries, the estimated changes in the distribution of income or consumption across households were small. There are a few reasons for this. In some countries, nearly all households experienced negative income shocks, regardless of their initial place in the income distribution. In other countries, the hardest-hit households—the urban poor—are not at the bottom of the national distribution. Instead in low-income countries, the poorest tend to live in rural areas and are employed in agriculture, the sector that was least affected by the pandemic. In yet other countries, income support from the government mitigated the income declines at the bottom.
Figure 3 shows the change in inequality in 2020 relative to 2019. The left panel exhibits the changes in the Gini index, and the panel on the right shows the changes in the top-to-bottom quintile income ratio. We find that 27 of the 34 countries had an increase in inequality as measured by the Gini index. The average increase was small, at slightly under 1 percent. Similarly, 30 of the 34 countries had an increase in the top-to-bottom quintile income ratios. For these 30 countries, the top quintile (relative to the bottom quintile) on average had 2.2 percent more income in 2020 compared with 2019.
Figure 3: COVID-19-induced distributional changes
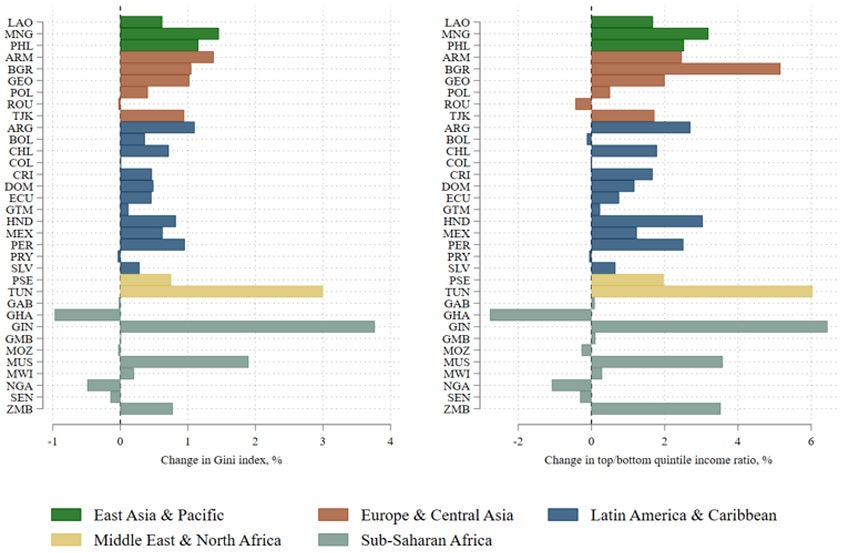
Source: Authors’ calculation based on High Frequency Phone Surveys.
The immediate impacts of the pandemic on income inequality within countries are likely to be small, according to these simulations. But they will likely to be compounded by factors that pose longer-term risks to inequality and social mobility, widening pre-existing inequalities of opportunity. As disadvantaged groups suffer larger, longer-lasting shocks, they are also more likely to adopt coping mechanisms, such as running down their savings and selling assets, which affect their economic prospects and ability to weather future shocks.
A slow and uneven jobs recovery in many developing countries raises the specter of increasing inequality in labor markets. A large share of children in poorer families had almost no access to learning opportunities during school closures in developing countries, leading to disparities in learning that could further reduce intergenerational mobility. To prevent these dis-equalizing trends from taking hold, policy interventions must target vulnerable households, children, and disadvantaged workers. They must also promote economic growth that supports a robust recovery in jobs and earnings.
We gratefully acknowledge financial support from the UK government through the Data and Evidence for Tackling Extreme Poverty (DEEP) Research Programme. This work has also been supported by a World Bank trust fund with the Republic of Korea, acting through the Korea Development Institute School of Public Policy and Management (KDIS), for the KDI School Partnership for Knowledge Creation and Sharing.
Watch live on Jan. 24 as World Bank Managing Director Mari Pangestu and a distinguished panel discuss COVID-19 and Rising Inequality: https://live.worldbank.org/covid-19-and-rising-inequality
[1] In addition to the phone surveys, Mahler ⓡ al. (forthcoming), utilizing various data sources, study the distributional changes for all 218 World Bank economies.


Join the Conversation