Say you want a snapshot on digital entrepreneurship in Tunisia, or you are trying to understand tourism trends in Mexico. You'll probably need to identify 30-50 relevant indicators, dig up the data, create a presentable format, and hope that you have organized the report the way an expert well-versed in the topic might. Yes, it can be very difficult to put together a report that gives you reliably sourced, current, and properly structured information on the topic you are interested in.
Fear not — help is at hand! On TCdata360, we offer you country-level reports on demand on a number of topics (tourism, gender, entrepreneurship, investment climate … and the list is growing). All you have to do is to go to our Reports section (tcdata360.worldbank.org/reports), choose your country and topic, and you're done — the site will give you a beautifully laid out report that you can share online or print and take to your next meeting.
Introducing TCdata360's thematic reports
The TCdata360 platform (tcdata360.worldbank.org) is a new open data initiative launched by the World Bank, which provides quick access to over 2000 trade and competitiveness indicators from over 40 international sources.

We shared a few ideas about improving data access and usability with you in an earlier blog post and one demand that kept emerging was to help people make sense of thousands of cross-cutting indicators, and communicate these insights in a simple, portable way. One of the ideas we came up with are these on demand reports. We have worked with subject matter experts to curate TCdata360 indicators and visualize them within the constraints of a two-pager country thematic report that are relevant to both experts trying to quickly gather reliable data, and to beginners exploring new topics.

Currently, we have five curated country reports in the TCdata360 Reports Section:
- Overall Country Snapshot
- Digital Entrepreneurship
- Tourism
- Gender
- Investment Climate
We're planning to add more thematic reports in the coming year. Send us ideas about what you will like to see next!
Why should you use these thematic reports?
Whether you're a casual TCdata360platform user, a domain-specific researcher or development practitioner, or a government employee who needs the latest data on your country, our TCdata360 thematic reports can help you swim through our 2000+ indicators by directing you to curated pools of understanding.

Here are some reasons why these thematic reports will be helpful in your work:
- Get the best indicators for the topic you need. These were carefully curated, intentionally picked, and bucketed under report subsections by subject matter experts to help users derive insights from these adjacent indicators.
- Save time by using these quality but concise briefers. Most of us don't have time to go through 2000+ indicators, so we curated the best ones for the theme and summarized them through charts within a brief 2-pager report. Perfect for sharing with your manager and teammates for regular country updates on a specific topic.
- Quickly share through a digital, printable format. Sharing information has never been easier. Just send your colleagues a link to our Reports Section (tcdata360.worldbank.org/reports) and voila — they all have access to the latest reports on topics relevant to trade and competitiveness, all with a click of a button.
Need to print these reports out? No problem! The report layouts are perfect to be printed on Letter (8.5" x 11") paper, but can be resized when printing if needed.
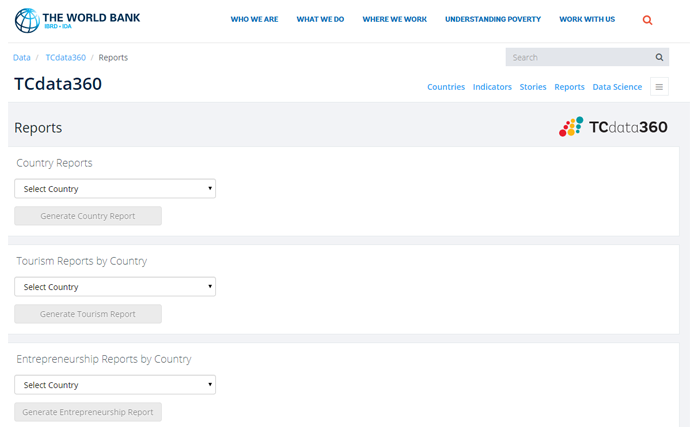
Screenshot of our easy-to-use Reports Section at tcdata360.worldbank.org/reports - Access up-to-date information, always. We always keep our thematic reports up-to-date. In the spirit of efficiency, we automatically generate all these reports using R code or a combination of HTML, CSS, and Javascript, wherein the code pulls the latest data from the TCdata360 API. No need to worry about getting up-to-date report data since the TCdata360 platform does that for you!
Our R code to generate these reports is open source, and is being improved on regularly for each new thematic report. Feel free to look through the latest reportGenerator360 code at https://github.com/asRodelgo/reportGenerator360. - Benefit from TCdata360's other features. Sometimes, having the thematic report isn't enough. If you or your colleagues need to download the source data so that you can make charts and reports yourselves, we've got you covered! Just go to our TCdata360 API to download the latest data, or go to any TCdata360 indicator page and click the "Download Source Data" link at the upper-right corner.

If you're an R user, we also developed data360r, a nifty R package to engage with our TCdata360 API. Read about data360r installation, examples, and use cases at https://tcdata360.worldbank.org/tools/data360r.
You can also read our blog for an overview of the benefits of using data360r.
What's Next?
In the coming months, we're planning on adding more thematic reports based on user demand, and setting up real-time automation for these reports when possible. We'll also be exploring more innovative ways of curating and visualizing our indicators to improve data accessibility and use.
We at TCdata360 are continually thinking of ways to improve our platform's data accessibility and usability for our diverse platform users — and we'd definitely love to hear what you think!
Do you want to suggest a new thematic report? Or do you have ideas or questions for TCdata360 or our Reports Section at tcdata360.worldbank.org/reports? Drop us a message at tcdata360@worldbank.org, or tweet with the hashtag #tcdata360.
The conclusions and opinions expressed in this blog do not represent the views of the World Bank Group.


Join the Conversation