Get the latest data stories and updates to the portal: Subscribe to our newsletter
In November 2022, more than 45,000 world leaders and climate activists convened in Sharm El-Sheikh, Egypt, for the preeminent international climate conference, COP27. Indeed, climate action—and the myriad of issues impacted by climate change, like health and immigration—have gained more prominence in recent years from both policymakers and financial markets. Environmental, Social, and Governance (ESG) investing, in various guises, has been a way for the financial sector to try to measure, price, and address these issues. The World Bank has followed these discussions closely and contributed data, tools, and analysis to help market participants to understand ESG investing from various vantage points.
The World Bank recently relaunched one of its tools for addressing these issues—the Sovereign ESG Data Portal. The portal has become an influential resource for the financial sector and is used by asset managers, investment banks, rating agencies, debt management offices, and ESG data providers to inform their approach to ESG investing in the sovereign debt asset class. A recent ESG investor survey by the Emerging Markets Investors Alliance highlights that the portal is the most used data source for sovereign ESG data, while Barclays Research lists the portal as close behind ESG score providers (from Barclays Research 2022 ESG Investor Survey). Moreover, even for many of the bespoke Sovereign ESG products produced by the industry, the portal often provides the majority of the underlying data.
With this experience, the data portal team saw an opportunity to build on past successes, incorporate user feedback and take it a step further. When we engaged with data users, the feedback was not on the framework itself. Instead, we identified two main areas for improvement: (i) closing data gaps and (ii) providing more guidance on using the data. Some of these are addressed in this relaunch; others will be tackled shortly. The new portal fills important data gaps, adds new indicators to the framework, and helps users better leverage the full potential of the World Bank’s sovereign ESG data.

What's new in the new portal?
The portal now includes 71 ESG indicators ranging from water stress, coastal protection, forest cover loss, heating and cooling degree days, precipitation anomalies, and new data on economic and social rights. It also includes additional indicators that give context to the ESG dimensions, such as the Human Capital Index, inflation, or land surface areas. The portal also shows how each country’s land cover has transitioned over time using satellite data from the European Space Agency. Moreover, the portal also allows users to incorporate a country’s wealth accounting profile, which reflects each country’s “balance sheet” in terms of long-term natural, produced, and human capital.
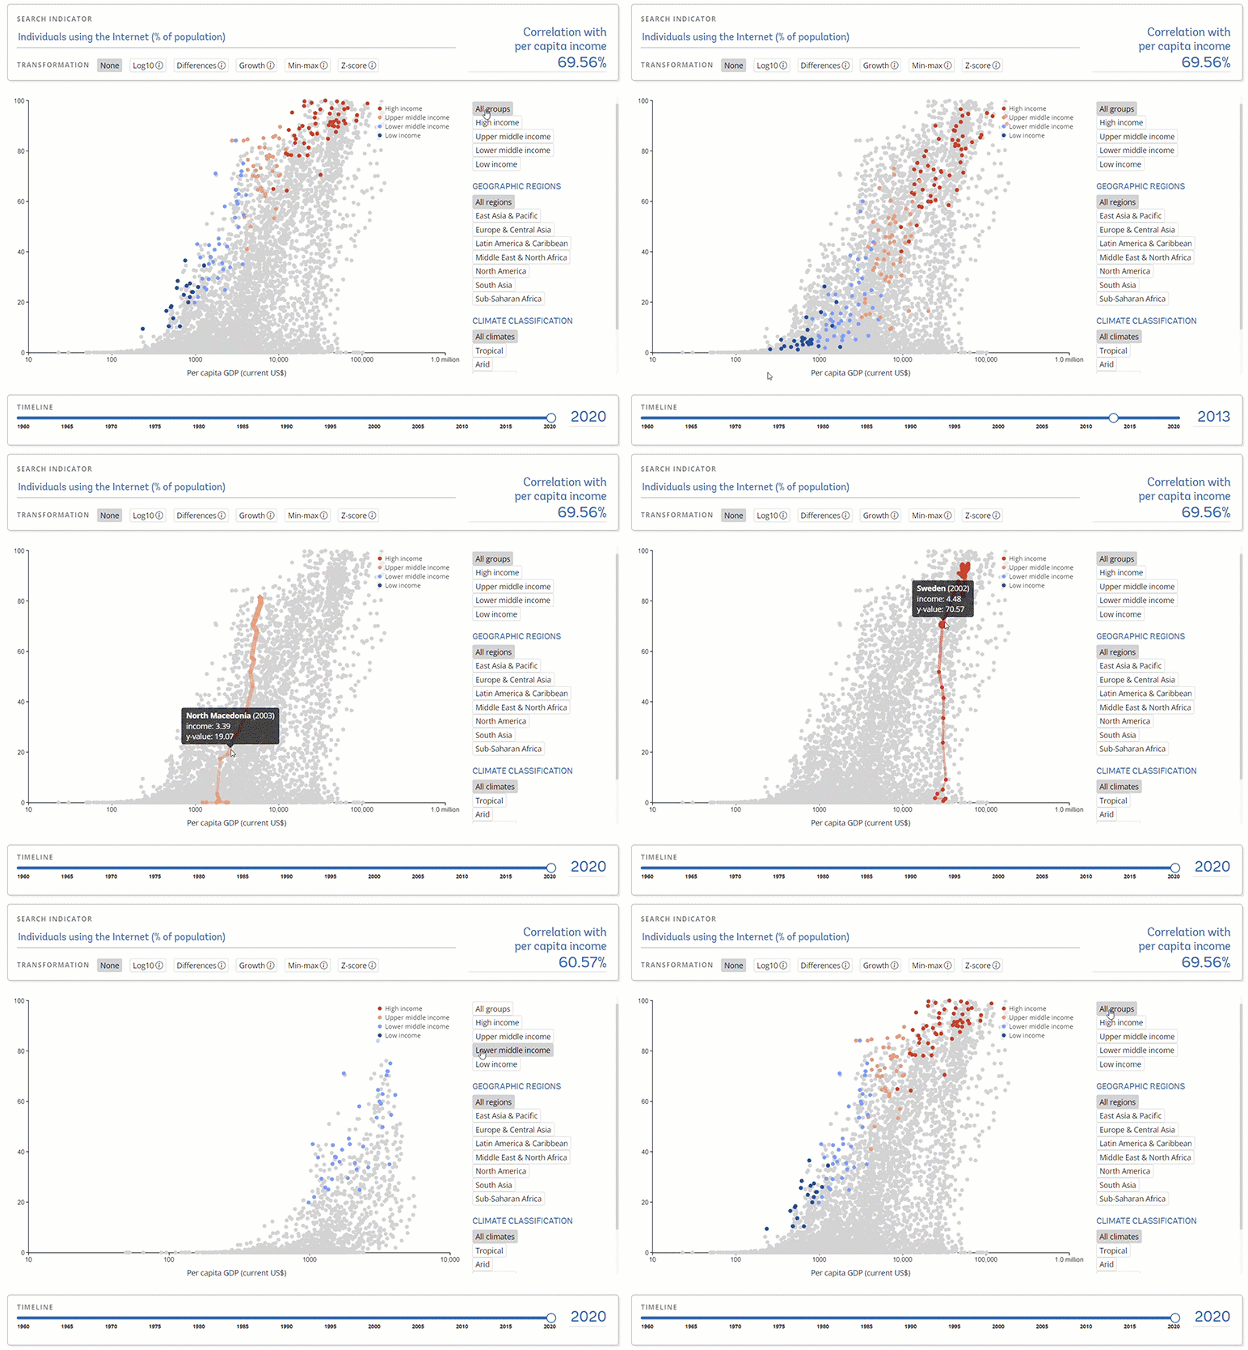
Country profile pages collect all relevant ESG data and key statistics—including new land cover profiles and wealth accounting profiles—in one place. The income adjustment tool helps users understand how the ingrained income bias affects various indicators—and how one can adjust for it. Interactive indicator graphs compare countries’ ESG performances with those of peer countries of the same income group, geographic region, or climate classification. A score builder tool constructs customized ESG scores in a 3-step process where users can determine the countries, indicators, and aggregation method.
Data is just part of the story
The continued rise in sustainable investing was probably only matched by the continued demand for more and better data. However, the supply of data did not grow on the same scale. This is not surprising since sovereign ESG and development are closely intertwined—and the latter is certainly not a new topic. The World Bank's World Development Indicators (WDI) started in April 1989 and has grown over the past three decades to more than 1,400 indicators.
This is why, even though the new portal added several new indicators, the focus of the relaunched version is to offer users a wide range of tools, visualizations, and data stories to better leverage and analyze the data. How has access to the internet evolved over time? Which countries are the leaders and the laggards in lowering fossil fuel energy consumption? How do countries perform in terms of literacy rates compared to their peers? Read our data story on the relaunch to understand how the new website can answer these questions.

What's next?
The sovereign ESG landscape has grown tremendously within just three years since our first launch. The new portal responds to this rapid development, by expanding the data framework and adding tools to better understand the data. Nevertheless, much remains to be done. Closing remaining data gaps, filling in the most recent values, and delving into practical applications are some of the items on the team’s agenda. Keep an eye on our data stories and subscribe to our newsletter to stay up to date on the latest developments.


Join the Conversation