 image: Forest panorama with sunsetlight
The World Bank’s new Terrestrial Biodiversity Database provides global coverage of locally relevant information that facilitates assessments of tradeoffs between development activities and biodiversity priorities.
The world is losing biodiversity at an unprecedented rate. One million plant and animal species are near or on the verge of extinction, and the rate of species extinctions continues to accelerate. Unfortunately, conservation efforts worldwide are often hindered by limited information on critical ecosystems and biodiversity.
To bridge this data gap, the World Bank recently developed the Terrestrial Biodiversity database. The database was constructed by integrating comprehensive information from overlapping habitat maps of 6,532 amphibians, 5,435 mammals, 4,291 reptiles, and 11,126 birds. These authoritative habitat maps represent all known and catalogued species in each area from the International Union for Conservation of Nature and Birdlife International, as well as information on 827 distinctive ecoregions from the World Wildlife Fund (WWF) covering the entire terrestrial world.
The database provides 36 intuitive biodiversity measures for each square kilometer of global territory, with rapid online access to 57 billion data cells. These measures include counts (presence/absence) of amphibians, birds, mammals, and reptiles; counts of critically endangered and endangered species; extinction risks; an index on the uniqueness of species; and an index on the uniqueness of ecoregions within a country. This information is useful in identifying ecologically vulnerable areas (areas with endangered and vulnerable species, areas with endemic species), which will contribute to conservation efforts worldwide.
One example of the database’s usefulness is its application to assess the environmental impacts of infrastructure projects as part of operationalizing green growth. Investment in transport infrastructure enables improved economic growth by lowering costs of moving goods and people. However, improvement of transport infrastructure may also provide access to areas hitherto less affected by human activities, thereby increasing the incentives to convert biodiversity-rich land into more commercial purposes. Transport planners need information on the spatial distribution of biodiversity indicators to mitigate this ecological vulnerability, but gathering the needed information for the proposed corridor and its alternatives has been both costly and time-consuming. By providing detailed biodiversity information to the global community, the database can support implementation of environmental safeguards for infrastructure projects and investment in environmentally sensitive infrastructure in a cost-effective and environmentally sound manner (Although the database is comprehensive and assembled with the best available information, project teams should supplement the information it provides with project specific data collection.).
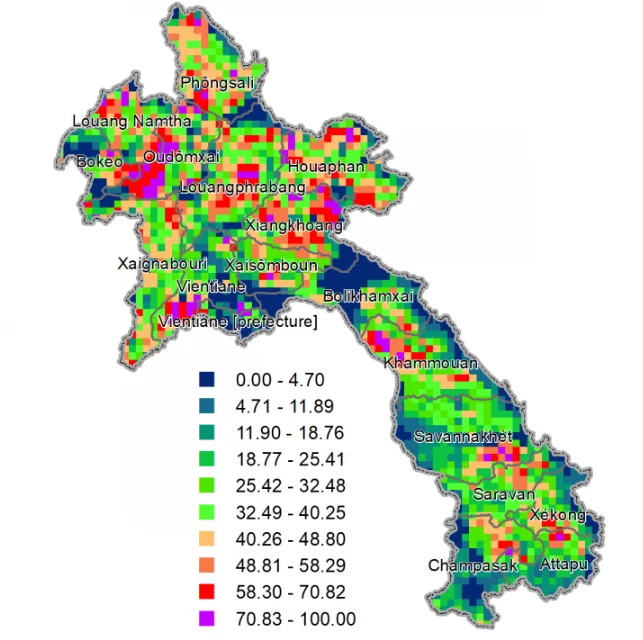
The map below illustrates the sort of information the database can provide. A composite indicator constructed from the database combined with forest cover data derived from satellite depicts potential changes in biodiversity due to forest clearing after a hypothetical future upgrading of all secondary and tertiary roads to primary status in Lao PDR as documented in a World Bank Policy Research Paper. Referring to the legend, the regions where biodiversity remains relatively unscathed due to the potential infrastructure upgrades appear in blue, while the regions where biodiversity is severely affected appear in red/magenta.
The results indicate significant clustering of the largest biodiversity impacts from road upgrading in southern Phôngsali, northwestern Louang Namtha, western Oudômxai, east-central Louangphrabang, northern and southeastern Houaphan, northeastern Xaisômboun, southwest Vientiane, northwest Khammouan, southeast Savannakhét, northeast Champasak and southern Xékong. Clusters of lower but substantial impact are also visible in widely-scattered locations.


Join the Conversation