
The Uganda Bureau of Statistics (UBOS) continues data collection for the Uganda High-Frequency Phone Survey (UHFPS). The survey was initially used to track the socioeconomic impacts of COVID-19 on the national population, but now has a wider scope to measure the impacts of other shocks as well. The financing for data collection and technical assistance has been provided by the World Bank, the Global Financing Facility, and the United States Agency for International Development (USAID). The survey recontacts households that had phone numbers for at least one household member or a reference individual from the Uganda National Panel Survey (UNPS) 2019/20. The first round of the survey was conducted in June 2020. The latest, ninth round was conducted in August 2022 more than two years after the pandemic started. A large module on vaccination for COVID-19 was administered in the latest round and selected findings are discussed in this blog.
Respondents were asked for the first time about their readiness to be vaccinated against COVID-19 in October 2022—way before the vaccination campaign started. About 84% of respondents agreed to be vaccinated at that time if an approved vaccine was available. Slightly higher agreement to be vaccinated was observed among respondents without formal education and those from the poorest quintile based on pre-COVID-19 consumption. Respondents reported on their actual vaccination status in round 9, conducted in August 2022. The results are shown in figure 1. Overall, about 62% of all respondents aged 15 plus have been fully vaccinated by getting two or more shots of the COVID-19 vaccine by August 2022. The youngest respondents (aged 15-24), those without formal education, and respondents from the poorest pre-COVID-19 consumption quintile had the lowest shares of fully vaccinated respondents. Even though the oldest respondents aged 65 and above have a high full vaccination rate, a sizable share of them remains unvaccinated: among them, 63% do not plan to be vaccinated or hesitate due to medical reasons, 13% do not feel it is as a priority, 13% worry about side effects and the remaining 11% mentioned other reasons. This is different from younger cohorts who avoided vaccination mostly because of side effects and low trust in vaccines.[1] Given that the elderly (65+) has the highest health risks from COVID-19, it is important for the Ministry of Health to understand and address their concerns, as well as provide firmer assurance of the benefits of vaccination.

Interestingly, reported readiness to be vaccinated has a significant positive impact on the probability of having full vaccination status, but not on the probability of having at least one shot as shown in figure 2. In order to test this, we run the multivariate logit model explaining the probability of being fully vaccinated (having two or more shots) and the probability of at least one shot. Self-reported readiness to be vaccinated was used as the explanatory variable. We also controlled for such factors as education, age, residence, and pre-COVID-19 consumption quintile status of respondents. Agreeing to be vaccinated reported in October 2020 is associated with an increased probability of being fully vaccinated by August 2022 by 17%, while association with probability of having at least one shot is not significantly different from zero.
To address the needs of different groups with regard to information about vaccines, it is important to understand which sources are trusted the most and through which channels information is obtained. As shown in figure 3, the most trusted sources of reliable information about COVID-19 vaccines include health workers, government authorities, and the media. Government authorities play a more important role for those without education and older respondents, while media is more important for those with secondary education and above. Information from these most trusted sources is mainly channeled via radio or in-person communication as shown in figure 3. The role of some channels differs across different groups. Thus, television is much more important among respondents with complete secondary education and above. In-person communication plays a more important role for the youngest cohort of respondents aged 15-24. Newspapers and social media do not play any role for respondents without education, but they are mentioned as channels to get information from the most trusted source by 17 and 13 percent of respondents with secondary education and above.

Besides self-reported vaccination rates, respondents were asked about their opinion on vaccination prevalence in the neighborhood. In particular, they were asked how many people out of 10 in the community had been already vaccinated against COVID-19. On average, about seven people out of 10 were vaccinated in the community according to respondents. We plotted the average number of people from this question reported by different groups of respondents along with self-reported vaccination rates (share of respondents obtained at least one shot). Results are shown in figure 5. Even though we combine answers to two different questions which measure different things, it is interesting to see that all bubbles are located to the left from the 45-degree line.
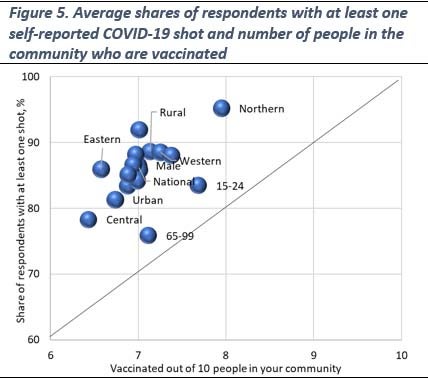
This implies that self-reported vaccination rates are consistently higher than what is reported by respondents about vaccination prevalence in the communities. Many reasons can be responsible for this discrepancy. First, this can be a result of an upward bias in self-reported vaccination rates due to social desirability in responses. Second, an upward bias in self-reported vaccination rates may be related to the non-random nature of respondents to the phone survey as many of them are heads of households who are older, more educated, and more resourceful than the general adult population. Finally, the question about vaccination prevalence in the communities was not using a clear definition for vaccination status which may create an additional discrepancy.
If you are interested to learn more about findings from the ninth round of the UHFPS, please check the brief here, while the microdata and related documentation are freely accessible at the World Bank’s Microdata Catalog here.
The members of the team working on the Uganda High-Frequency Phone Survey on COVID-19 (listed in alphabetical order for each institution) are:
UBOS: Stephen Baryahirwa, Audrey Kemigisha, and Andrew Mupere; World Bank: Aziz Atamanov (Poverty and Equity GP), Frederic Cochinard (LSMS), John Ilukor (LSMS), Talip Kilic (LSMS), and Giulia Ponzini (LSMS).
[1] Due to the small sample size, results should be treated with caution.


Join the Conversation