When doing data analysis, it's common for indicators to take the spotlight whereas datasets usually take the backseat as an attribution footnote or as a metadata popup.
However, we often forget how intertwined dataset sources are and how this affects data analysis. For instance, we can never assume that indicators from different datasets are mutually exclusive – it's possible for them to be the same indicator or to have an influence on the other as a component weight in an index, if the other dataset were used as a source for the other.
In this blog, we're interested to see if this applies to TCdata360 by taking a deeper look at its "dataset genealogy" and answer questions such as – Is it safe to do cross-dataset analysis using TCdata360 datasets? Are there interesting patterns in the relationships between TCdata360 datasets?
Quick introduction to network graphs
We call a dataset which serves as a data source for another dataset as "source", and a dataset which pulls indicator data from another as "target". Collectively, all of these are called "nodes".
To see the relationships between TCdata360 datasets, we mapped these in a directed network graph wherein each dataset is a node. By directed, we mean that source nodes are connected to their target nodes through an arrow, since direction is important to identify source from target nodes. For the purposes of this blog, we restricted the network graph to contain datasets within TCdata360 only; thus, all data sources and targets external to TCdata360 will not be included in our analysis.
Here's how the network graph looks like.
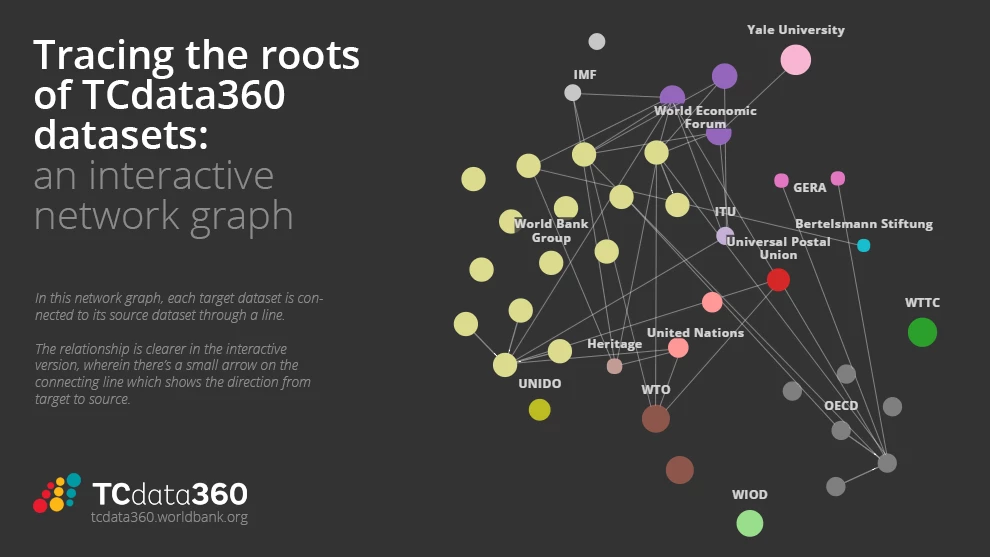
Each dataset is represented by a circle (aka "node") and is grouped and color-coded by data owner or institution. The direction from any source to target node is clearer in the interactive version, wherein there's a small arrow on the connecting line which shows the direction from target to source.
Excited to explore and dive in the network graph on your own? Here are a few ways you can interact with our embedded network graph which we made using Rhumbl:
- Zoom in or out using slider at the bottom right.
- To focus on a specific dataset's relationships, hover/click on a desired dataset to display only itself and its data sources.
- To find a particular dataset or dataset(s), type in keywords using the search bar on the upper left. Select the "Show on map" checkbox to locate the search results on the network graph.
- You can also get more information on each dataset — such as dataset URL, associated TCdata360 topic levels, number of TCdata360 indicators — by typing the name of the dataset on the search bar.
You can also browse the map as a full page by going to: https://rhumbl.com/engine/embed/59f24e3e895e65001029cd66
Is it safe to do cross-dataset analysis using TCdata360 datasets?
To answer this question, we complement the network graph by looking at the distribution of source and target nodes in the TCdata360 dataset genealogy through a quick pie chart:
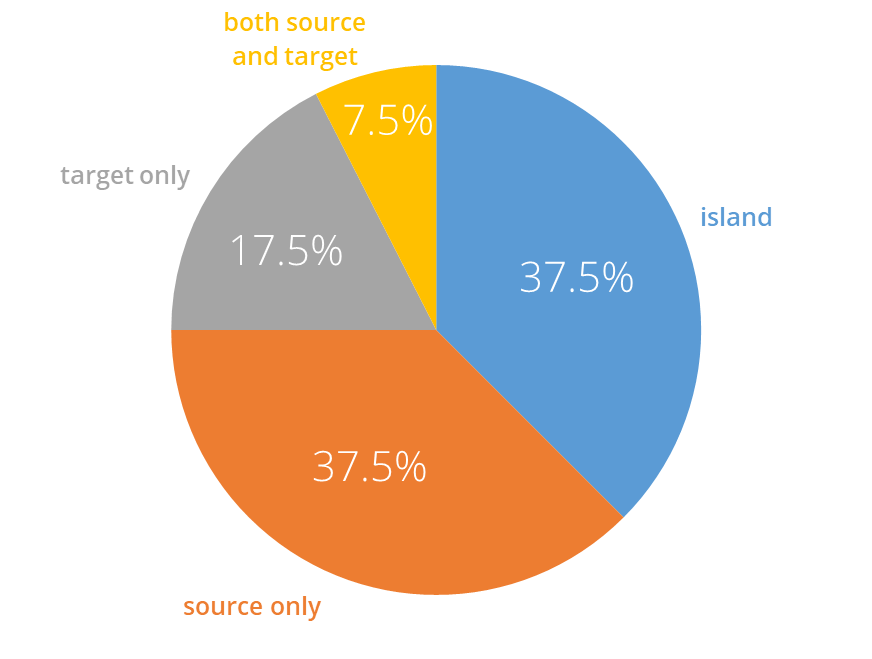
What can we take away from this pie chart and the network graph? In general, it's relatively safe to do cross-dataset analysis using TCdata360 indicators.
We can say this since (1) TCdata360 datasets are mostly unconnected in terms of sources, (2) there are relatively few target datasets which need to be considered when doing cross-dataset indicator analysis within TCdata360, and (3) there are even fewer datasets that need to be double-checked since only 3 datasets have a "lineage" longer than 1 source dataset (that is, the indicators' original source is two datasets away).
To drive the point home, let's break this down into three key findings based on the pie chart and the network graph:
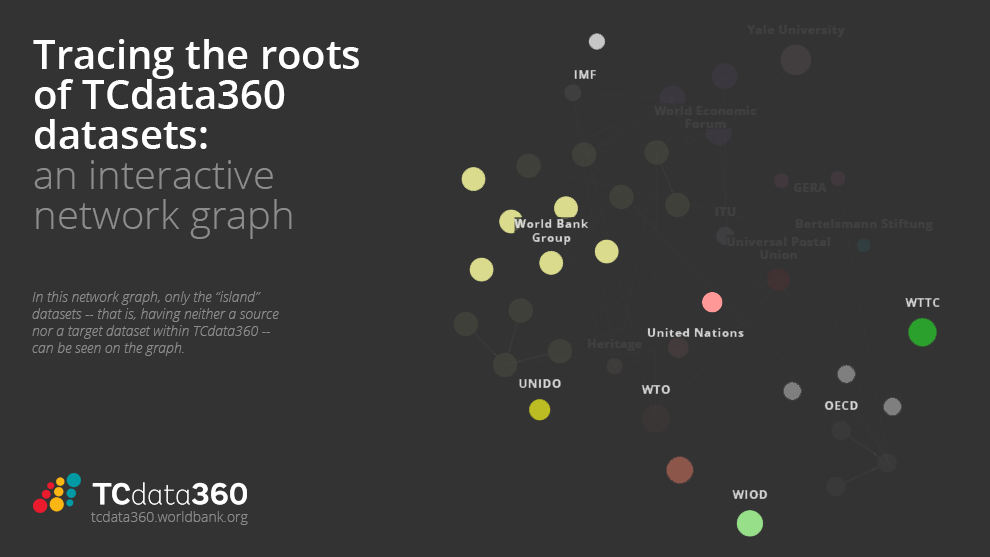
1. TCdata360 datasets are mostly unconnected.
One-third of TCdata360 datasets are islands – that is, being neither a source nor a target within TCdata360 – and are thus unconnected to the rest of the network graph. One-third is quite a big amount, majority of which come from WBG and OECD. Note that it's possible for an "island" to have a source dataset as long as it's external to TCdata360.
What are common characteristics for these islands within TCdata360? Some of these are focused surveys — that is, topic-specific datasets which uses survey responses as their main data source such as WBG's Investing Across Borders and Citizen Engagement in Rulemaking, and hence has no external source dataset. The rest are datasets which simply have data sources that aren't in TCdata360, such as UNIDO's Competitive Industrial Performance Index and OECD's Trade in Value Added.
You can see these on the network graph as the "nodes" which aren't connected to any other node, as emphasized in the network graph below.
2. There are relatively few target datasets.
Out of all 40 TCdata360 datasets explored, almost half of these act as sources for its targets, which is just one-fourth of all TCdata360 datasets.
Of note are the top 3 most sourced datasets – WBG World Development Indicators (WDI), Doing Business, and the ITU database. What's interesting to note is that these 3 serve as direct sources for all 3 WEF datasets in TCdata360!
 |
 |
 |
| World Development Indicators | Doing Business | ITU Database |
3. Only 3 datasets are both a source and a target, and the longest "lineage" is 3 linked datasets.
Only 3 out of all 40 datasets (or 7.5%) serve as both a source and a target, namely -- Heritage Index of Economic Freedom, OECD Services Trade Restrictiveness Index, and WEF Global Competitiveness Index.
We considered all possible paths on our network graph, and discovered that the "longest [directed] path" in our directed network graph is only 2 paths long, which means that the "lineage" of any TCdata360 dataset is composed of at most 3 linked datasets.
Why is this important? It shows how much indicators from datasets influence other datasets — even those not mentioned in their "sources and methodology" sections! — by checking their source datasets' respective sources, and these sources' sources. Because of this often unseen influence, it's important to be aware of these lineages before doing any cross-dataset analysis.
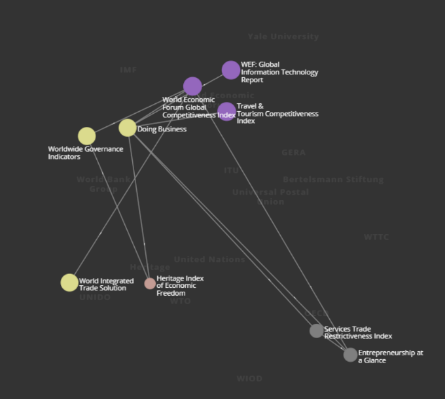
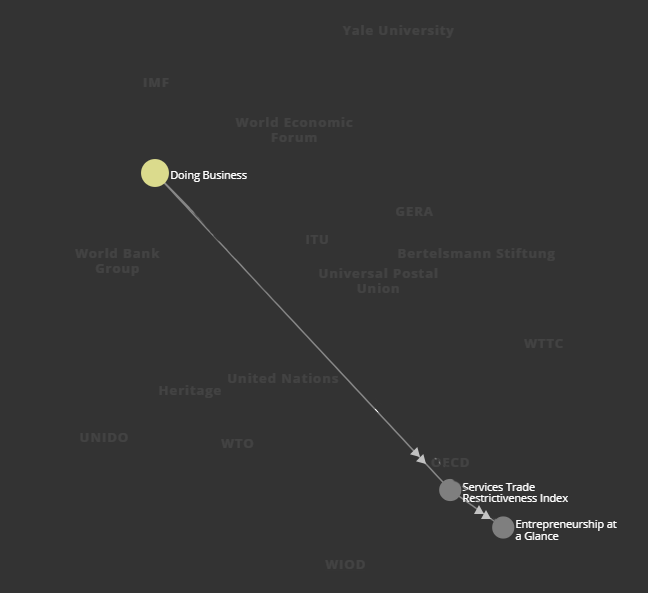
One such example is this path (as seen in the diagram below): the OECD Entrepreneurship at a Glance dataset sources indicators from the OECD Services Trade Restrictiveness Index (STRI) — specifically, for the STRI indicator under "Access to Foreign Markets" for Market Conditions — whereas STRI in turn sources data from the WBG Doing Business dataset to compute for its continuous measures under policy heading "Regulatory transparency and administrative requirements".
Overall, these findings are good news from a data analysis perspective, since they collectively mean that it's relatively safe to do cross-dataset analysis using TCdata360 indicators.
Now let's try to look deeper — are there underlying patterns in the way nodes are connected?
Looking for Patterns in Dataset Clusters
For this analysis, we only kept the nodes in the network graph with at least 1 other node connected to it since clusters are determined by the connections between nodes.
For clustering, we applied the Louvain Modularity algorithm (at modularity 1.3), which is a fast, well-known community detection algorithm for network graphs. A community is a group of nodes which are more densely connected to each other compared to the rest of the network graph. Note that we only considered the nodes' connections with other datasets in locating clusters – we didn't consider the topic, data owner, and other dataset metadata in clustering.
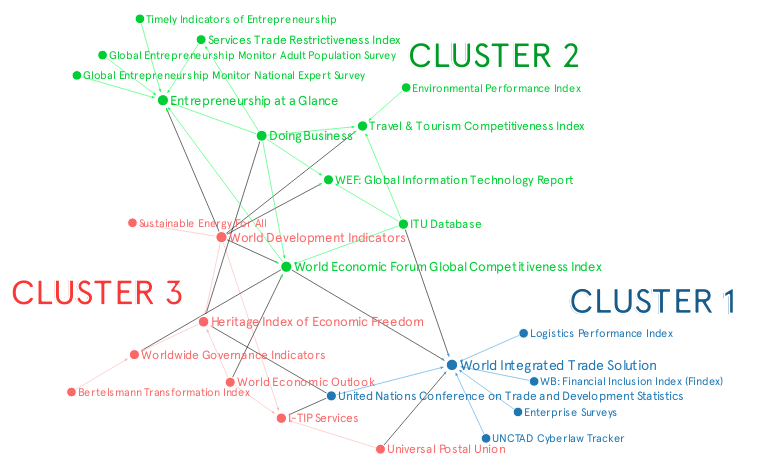
We then used Graph Commons to implement and create the clustered network graph, as seen in the image below.
Now, what can we take away from these clustered nodes?
1. Clustered datasets tend to have the same topics. (But different topics can still be bridged by a few datasets.) Datasets within the same topic or subtopic tend to share indicators with one another. For instance:
- Cluster 1 datasets are mostly focused on Trade.
- Cluster 2 datasets are mostly focused on Competitiveness, Entrepreneurship, and Business.
- Cluster 3 datasets are mostly focused on Economy and other topics.
However, it's worth noting that these clusters aren't totally separate – they're bridged by datasets which have a broad range of indicators, such as World Development Indicators. This is a good sign, since datasets from different topics still have shared lineages through these "bridge" datasets.
2. Clustered datasets tend to gravitate towards a specific set of data owners or providers. Some data owners or providers tend to gravitate towards one another for sourcing data. For instance:
- Cluster 1 has mostly World Bank Group and United Nations datasets.
- Cluster 2 has mostly World Economic Forum and OECD datasets (with WBG Doing Business and ITU database as special mentions).
The exception is Cluster 3, which has datasets coming from diverse institutions. This is probably due to having "World Development Indicators" as one of its members, since this dataset is often used as a source for various datasets due to its broad range of indicators.
Conclusion
Overall, it's interesting to see how TCdata360 datasets influence each other in terms of sourcing data, as well as uncover some patterns for dataset clusters. We were able to surface a few insights above, but we also recognize that our insights are limited since the TCdata360 dataset network graph is mostly unconnected and has relatively few connections to begin with.
To unlock the full potential of this "dataset genealogy" exercise, we highly encourage you to implement this in your own open data platforms — or even the wider open data ecosystem! — as it would be wonderful to see more complex, underlying patterns in dataset clusters as well as dataset lineages to be mindful of when doing cross-dataset analysis. To get you started, here's a list of helpful links we used to create the interactive network graphs in this blog post:
- Rhumbl - Allows you to easily create free, online, interactive network visualizations using data from spreadsheets.
- Graph Commons - Another free online network visualization tool, but also allows you to do network analysis such as clustering (using the Louvain Modularity algorithm) and compute for centrality measures such as degree centrality, indegree centrality, outdegree centrality, and betweenness centrality.
Are you interested to do a similar analysis, or did you see anything interesting on the interactive network graphs above? If you have ideas or questions about our blog or TCdata360 in general, we'd be more than happy to hear your thoughts! Drop us a message at tcdata360@worldbank.org, or tweet with the hashtag #tcdata360.
The conclusions and opinions expressed in this blog do not represent the views of the World Bank Group.

Join the Conversation