 A Bank in Lao PDR
We have decided to release the latest data on worldwide remittance flows via this blog. For the latest data on global migration and a well-rounded discussion of issues relating to migration, remittances and development, please refer to the recent World Bank report.
The first part of the blog covers remittance flows, which is SDG indicator 17.3.2. The second part reports on remittance costs, which is SDG indicator 10.c.1. No significant data updates were available on recruitment costs, SDG indicator 10.7.1.
Thanks to Kebba Jammeh, Immaculate Nafula Machasio and Maja Vezmar for research assistance and Rebecca Ong for communications support.
Remittance flows worldwide
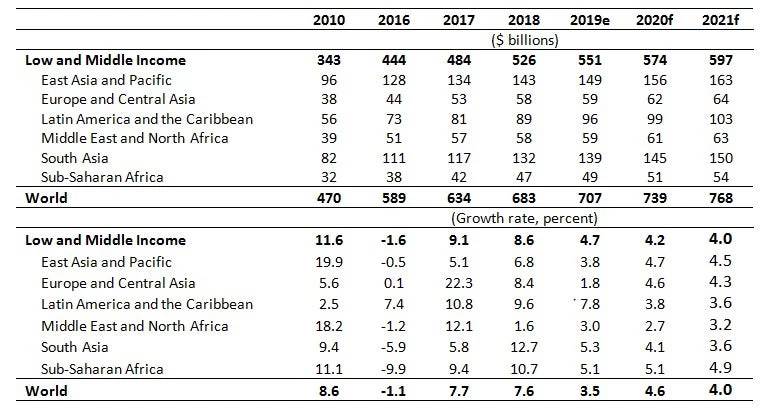
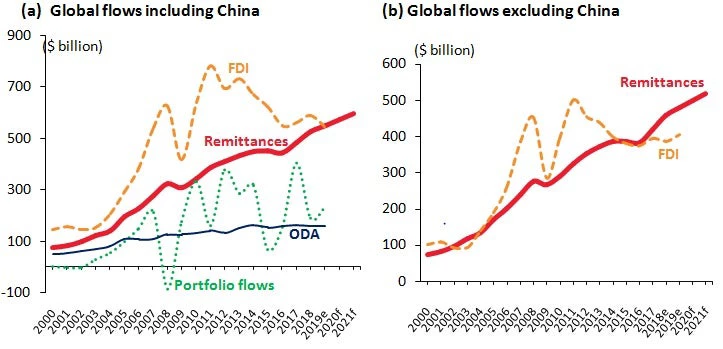
Remittance flows to low- and middle-income countries (LMICs) are expected to reach $551 billion in 2019, up by 4.7 percent compared to 2018 (table 1). Remittances have exceeded official aid – by a factor of three – since the mid-1990s. This year, they are on track to overtake foreign direct investment (FDI) flows to LMICs (figure 1).
Figure 1: Remittances on track to overtake FDI flows
Sources: World Bank-KNOMAD staff estimates, World Development Indicators, and International Monetary Fund (IMF) Balance of Payments Statistics.Note: FDI = foreign direct investment; ODA = official development assistance.
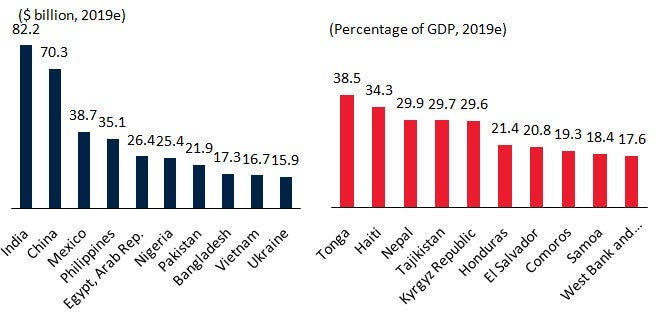
In 2019, in current U.S. dollar terms, the top five remittance recipient countries are projected to be India, China, Mexico, the Philippines, and Egypt (figure 2). As a share of gross domestic product (GDP) for 2019, the top five recipients would be smaller economies: Tonga, Haiti, Nepal, Tajikistan, and the Kyrgyz Republic.
Figure 2: Top recipients of remittances, 2019
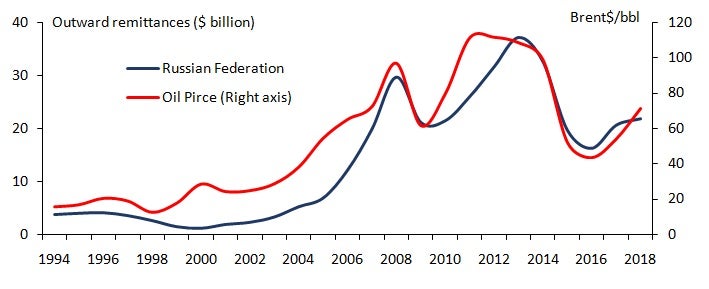
Growth of remittance flows slowed to 4.7 percent in 2019 compared to a robust 8.6 percent in 2018 . Cyclical factors affecting the growth of remittance flows include (a) economic growth in source countries, (b) the price ofoil, and (c) variations in exchange rates . For example, a strong economy and employment situation in the United States implies buoyant remittance flows to Latin America and the Caribbean. Conversely, weak oil prices imply lower growth in outward remittances from the Russian Federation to Central Asian and Eastern European countries (figure 3).
Table 1: Estimates and Projections of Remittance Flows to Low- and Middle-Income Regions
Source: World Bank-KNOMAD. See appendix A in World Bank (2017) for data and forecast methods.
Notes: e = estimate; f = forecast. Projections for 2019, 2020 and 2021 are based on a low case scenario that assumes unit elasticity of remittances to GDP growth in remittance source countries.
Figure 3: Oil prices impact outward remittances from Russia
Sources: World Bank-KNOMAD staff estimates, World Development Indicators, and International Monetary Fund (IMF) Balance of Payments Statistics.Note: Four quarter moving averages.
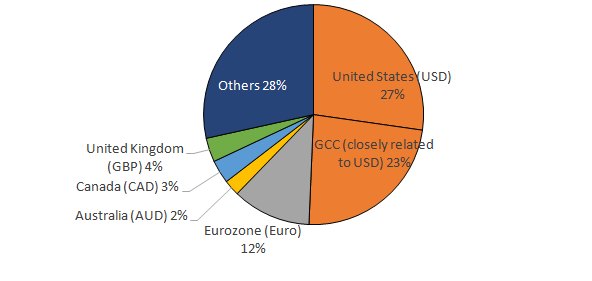
When the currency of a source country depreciates against the US dollar, the value of outward remittances in US dollar terms declines. Approximately a half of remittance flows to LMICs is estimated to originate in countries where US dollar is the main currency or the local currency is closely linked to the US dollar (e.g., the Gulf Cooperation Council (GCC) countries); the rest are denominated in other currencies and therefore subject to currency valuation effects. For example, 12 percent of such remittances originated in Euro-zone economies, 4 percent in the United Kingdom, 3 percent in the Russian Federation, 3 percent in Canada, and 2 percent in Australia (figure 4).
Figure 4: Sources of remittance flows to LMICs by currency
Sources: World Bank-KNOMAD staff estimates. Note:AUD=Australian dollar, CAD=Canadian dollar, GBP= British Pound, USD =US dollar
Remittances outflows from some major sending countries other than the US have been impacted due to the depreciation of their currencies against the US dollar. For example, the euro depreciated by 8 percent and the ruble by 16 percent against the US dollar, as of the first quarter of 2019. As a result, even as outward remittances in Germany and Russia increased in local currency terms, they declined in US dollar terms (table 2).
Table 2: Decline in Remittance Outflows in Dollar Terms Due to Depreciation of Sending Currencies

Notes: Calculations for 2019 Q1 compared to a year ago. Data on outward remittance flows are available until 2019 Q1. Sources: World Bank-KNOMAD staff estimates based on data from IMF Balance of Payments Statistics and International Financial Statistics databases.
Regional remittance flows
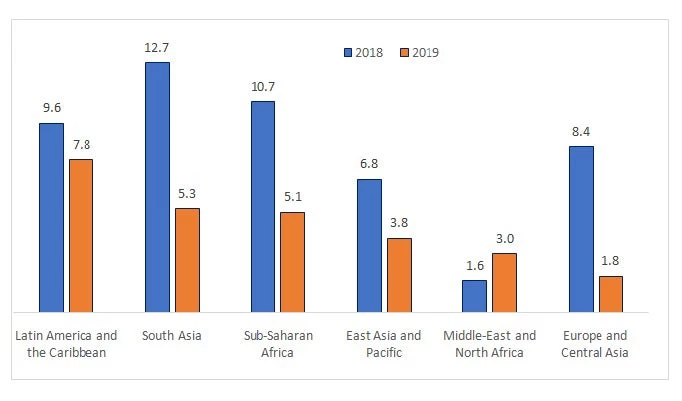
The slowdown in the growth of remittances in 2019 was sharp in all regions except LAC and SSA (figure 5). In 2019, Latin America and the Caribbean would see the fastest pace of remittance growth at 7.8 percent due to the continued robustness of the US economy. Remittances would increase moderately in South Asia (5.3 percent), Sub-Saharan Africa (5.1 percent) and East Asia and Pacific (3.8 percent) due to the buoyancy in inflows from the US being offset by slower growth of receipts from the Euro area and the GCC. The growth rate of remittances is likely to remain weak in Middle East and North Africa (3 percent) due to structural changes, such as labor market ‘nationalization’ and introduction of value added tax, in the GCC countries, and in Europe and Central Asia (1.8 percent)because of lower oil prices and ruble depreciation on outflows from Russia.
Figure 5: Growth of remittances by region (%)
Sources: World Bank-KNOMAD staff estimates.
Remittance flows are projected to reach $597 billion in 2021
Assuming that outward remittances growth in tandem with the nominal GDP (in US dollar terms) of the source countries, these flows are projected to reach $574 billion in 2020 and $597 billion by 2021.This forecast methodology is conservative, as it does not account for increasing migration flows, falling remittance costs, and progress in technology of remittance services (For a description of the methodology used to forecast remittance flows, see World Bank 2017).
However, there are downside risks to this outlook in the next two years. Foremost among the risks is anti-immigration sentiment in almost all large host countries for migrants, including the United States, Europe, Russia, and South Africa. Even in the GCC countries, where the economies are critically dependent on migrant workers, the policy stance is to discourage recruitment of foreign workers in order to stimulate employment of nationals and impose taxes or other restrictions on outward remittances.
In the medium-term, the growth of remittances would continue to be restrained by high costs of remittances and stringent financial regulations, which are discussed next.
In the long-term, say, ten years in the future, the risks are on the upside, mostly due to the fact that global migration flows are expected to increase significantly (see 2019 World Bank Report). The average income gap between high-income countries and low-income countries, a fundamental driver of migration, presently stands at 54:1 (over $43,000 vs under $800), which would encourage more migration from LMICs. Demographic change is a second fundamental driver of migration: by 2030, the working age population of the LMICs is expected to increase by over 550 million – it is likely that a significant part of this population would not find jobs or well-paying jobs in the country of birth, thus, increasing migration pressures. A third fundamental driver is climate change, which could displace as many as 143 million persons, according to the World Bank’s 2018 Groundswell report. Additionally, migration and refugee movement may also increase due to fragility, conflict and violence.
Remittance costs remain well above the SDG target
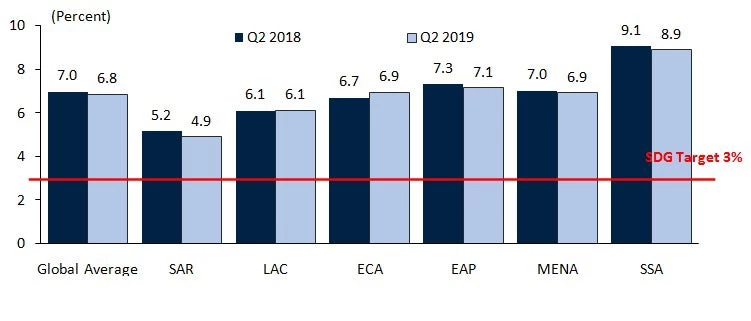
According to the World Bank’s Remittance Prices Worldwide Database, the average cost of sending $200 to LMICs was 6.8 percent in the second quarter of 2019, only slightly below previous quarters (figure 6). This is more than double the Sustainable Development Goal (SDG) target of 3 percent by 2030 (SDG target 10.c). The cost was the lowest in South Asia, at around 5 percent, while Sub-Saharan Africa continued to have the highest average cost, at about 9 percent (figure 6). Remittance costs across many African corridors and small islands in the Pacific remain above 10 percent.Note that intra-regional migration in Africa is over two-thirds of all international migration from Africa – past studies have pointed out very high costs for sending money within Africa (Leveraging Migration for Africa, World Bank, 2011), although no recent data are available presently on such South-South remittance costs.
Figure 6: How Much Does It Cost to Send $200?
Source:Remittance Prices Worldwide database, World Bank.
Note: EAP = East Asia and Pacific; ECA = Europe and Central Asia; LAC = Latin America and the Caribbean; MENA = Middle East and North Africa; SAR = South Asia; SSA = Sub-Saharan Africa.
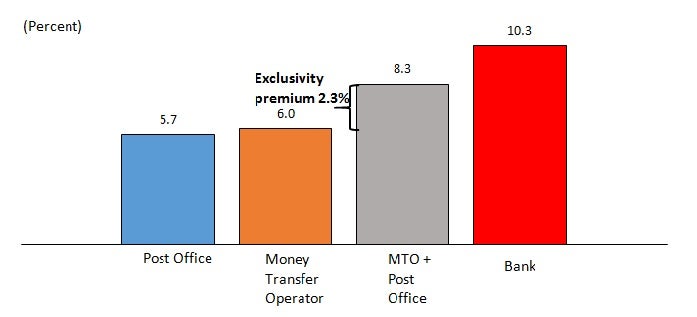
Banks are the costliest channel for sending remittances, with an average cost of 10.3 percent in 2019 Q2, while post offices are lowest at 5.7 percent. Also, in an apparent example of policy incoherence, remittance costs tend to include a premium, a cost mark-up, when national post offices have exclusive partnership arrangements with a dominant money transfer operator (MTO). Such premia average 2.3 percent of the cost of transferring remittances worldwide and are as high as 4.6 percent in the case of India, the largest recipient of remittances (figure 7). Opening up national post offices, national banks, and telecommunications companies to partnerships with other MTOs could remove entry barriers and increase competition in remittance markets .
Figure 7: Average Costs of Remittances by Type of Provider, 2019 Q2
Source:Calculations by World Bank-KNOMAD staff for 2018 Q4 based on the Remittance Prices Worldwide database, World Bank. Note: MTO = money transfer operator.
Regulations relating to anti-money laundering and countering the financing of terrorism (AML/CFT) tend to be onerous in the case of cash remittances which are used by unbanked migrant workers and their families back home. Compliance with such regulations is easier in the case of remittances originating from bank accounts. There has been a rapid increase in mobile-phone and internet-based technology solutions for providing remittance services, and more recently, in block-chain-based applications. However, such fintech solutions almost exclusively rely on banks to provide the know-your-client compliance requirements, thus limiting themselves to banked customers and leaving out a vast majority of unbanked customers who may be encouraged to use informal remittance channels.



Join the Conversation