The simplest way to think about international trade is the transfer of goods – cars, clothing, bananas. Countries that export more goods are generally better off, because they’re earning money, which allows them to import and build their economies in the process. But services are also vital to exports. In fact, services play a dual role in building an economy’s export competitiveness.
For one, services matter for manufacturing and agriculture exports. Take tee-shirts for example. Sure, they’re made of cotton, but they’re also the result of many service industries. This can include transporting cloth to the factory, tee-shirt design, testing to ensure quality standards are met, and branding and marketing for sale on international markets. All are part of the tee-shirt exporting process. [1]
The second role services play in export competitiveness involves diversification. With cost reductions and technological progress, services have become more tradeable. Exporting services provides an opportunity for export diversification and growth, which is important for economic stability. If global demand for one sector drops, a country with diversified exports can rely on others such as banking, transport, or business services.
Many governments are interested in how services support their country’s exports and economy at large. For example, how much value added do services exports, such as transport or communications, generate in a country? And how much of that is generated directly versus indirectly as inputs like transportation in our tee-shirt example? What types of services inputs, and is that different from comparator countries?
Answers to such questions are typically left unanswered because systematic data is not readily available on how services contribute to exports across developing countries and sectors.
The Export of Value Added (EVA) Database was developed to fulfill this need. The database was recently launched on the World Bank Group’s World Integrated Trade Solutions (WITS) data website. It includes data for user-specific queries and also has data for bulk download.
The EVA Database measures the domestic value added contained in exports for about 120 economies across 27 sectors, including nine commercial services sectors, three primary sectors, and 14 manufacturing sectors. The data spans intermittent years between 1997 and 2011.
What sets the EVA Database apart is the wide coverage of developing countries: over 70 of the economies included are low- and middle-income.
Measuring trade on a value-added basis makes it possible to see a sector’s direct value-added contribution to exports as well as the linkages to other sectors of the economy. So, in the case of our tee-shirt example, it could tell you how much value added the transport sector contributes to $100 of exported goods. This includes both forward linkages (the contribution of a particular sector as an input to others sectors’ exports) and backward linkages (the contribution of all other sectors to a particular sector’s exports).
Services trade data is usually measured in gross values: direct value added plus domestic and foreign intermediate inputs. Measuring gross exports may undervalue a sector’s real contribution to trade if its value added is embedded as inputs in other sectors’ exports, something that is particularly true for services exports. On the other hand, gross measures may overvalue a sector’s importance if exports are embedded in other sectors’ value-added inputs, something that is particularly true for manufacturing exports.
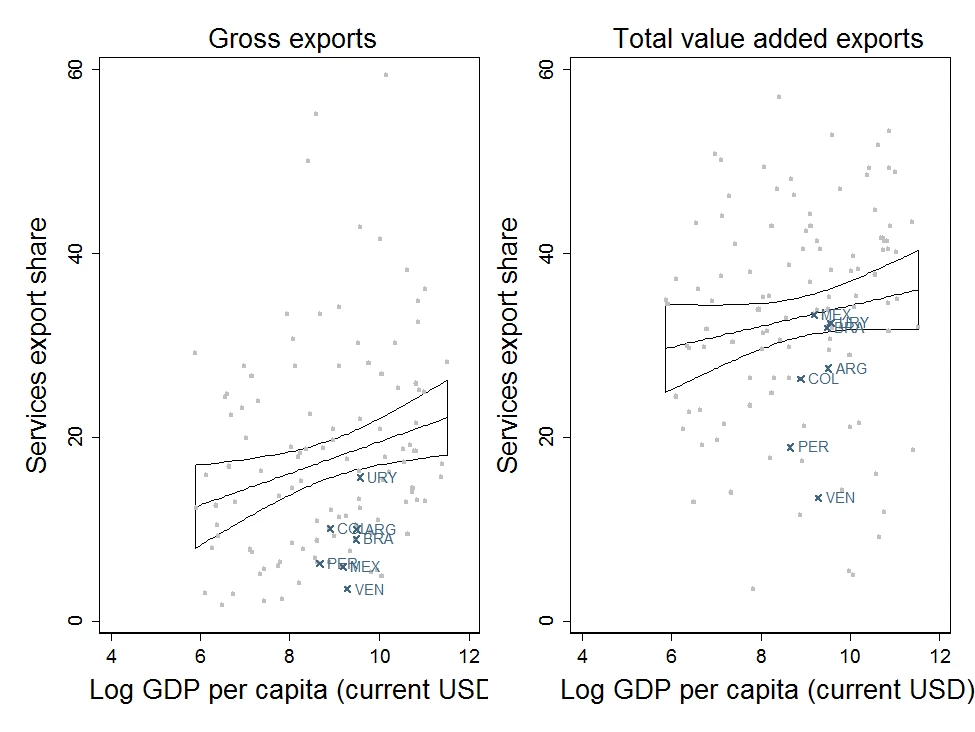
This alternative way of measuring trade overcomes this shortcoming, as illustrated clearly in the EVA data presented below. We plot the percent of services in total exports, measured as gross values in the left panel, and total value added (direct plus forward linkages) in the right panel. With EVA data, the share of services in total exports increases for all highlighted Latin American countries, indicating that gross exports tend to undervalue the importance of services for a countries’ export basket.
Thus, we are able to provide a better picture of services exports by considering both the direct contribution and indirect contribution via forward linkages.
Figure 1: Share of services in exports, 2011

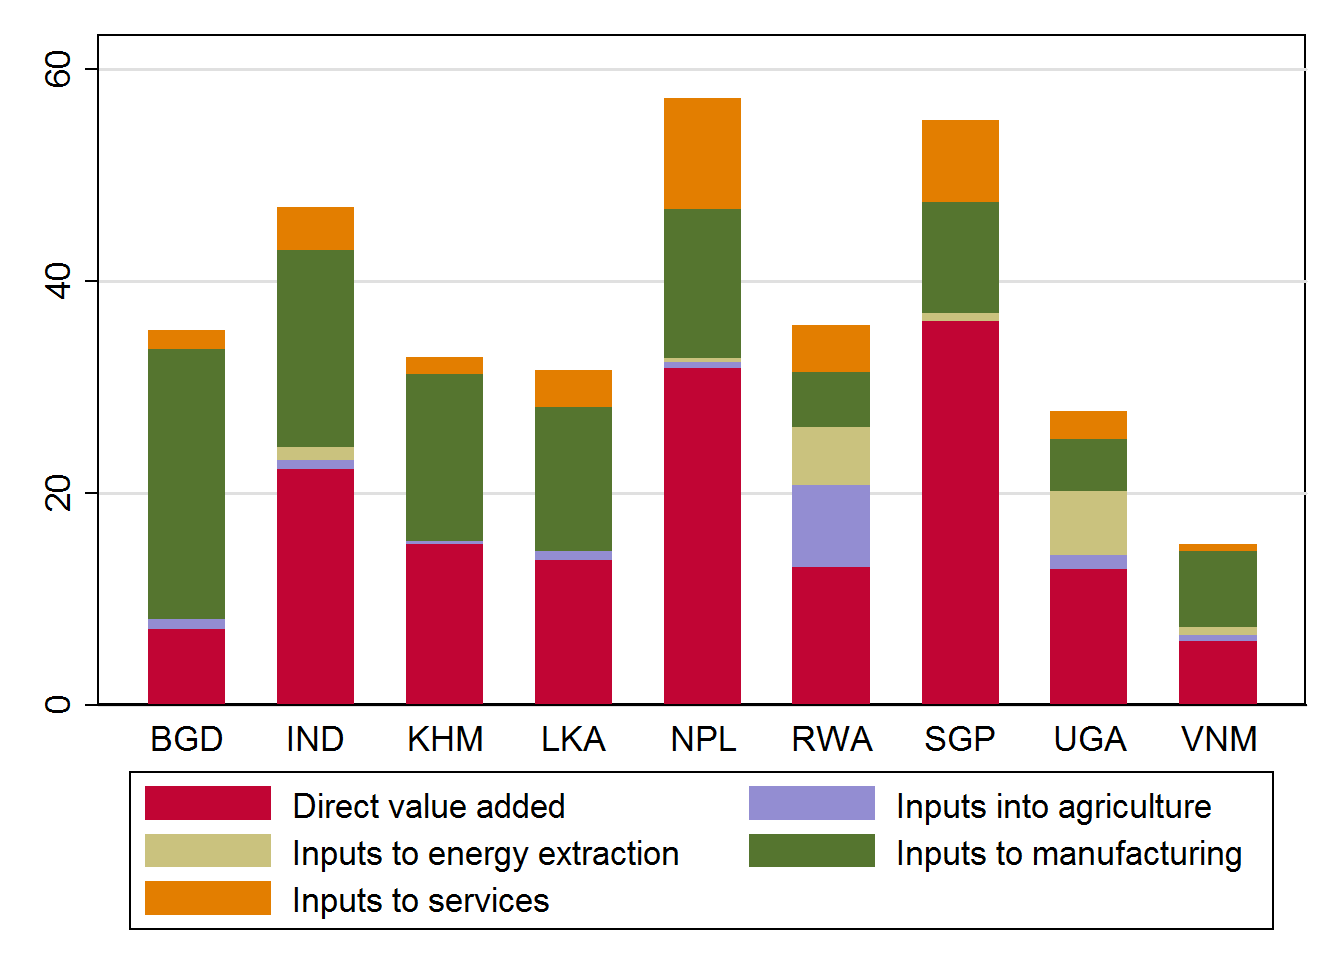
The EVA data also allows us to split services exports into its direct and indirect contributions. In Nepal and Singapore, services generate almost 60% of total export value added. More than half of this is done directly within the services sector. In Bangladesh, on the other hand, services are more important for other sectors like manufacturing.
Figure 2: How domestic services support exports, 2011

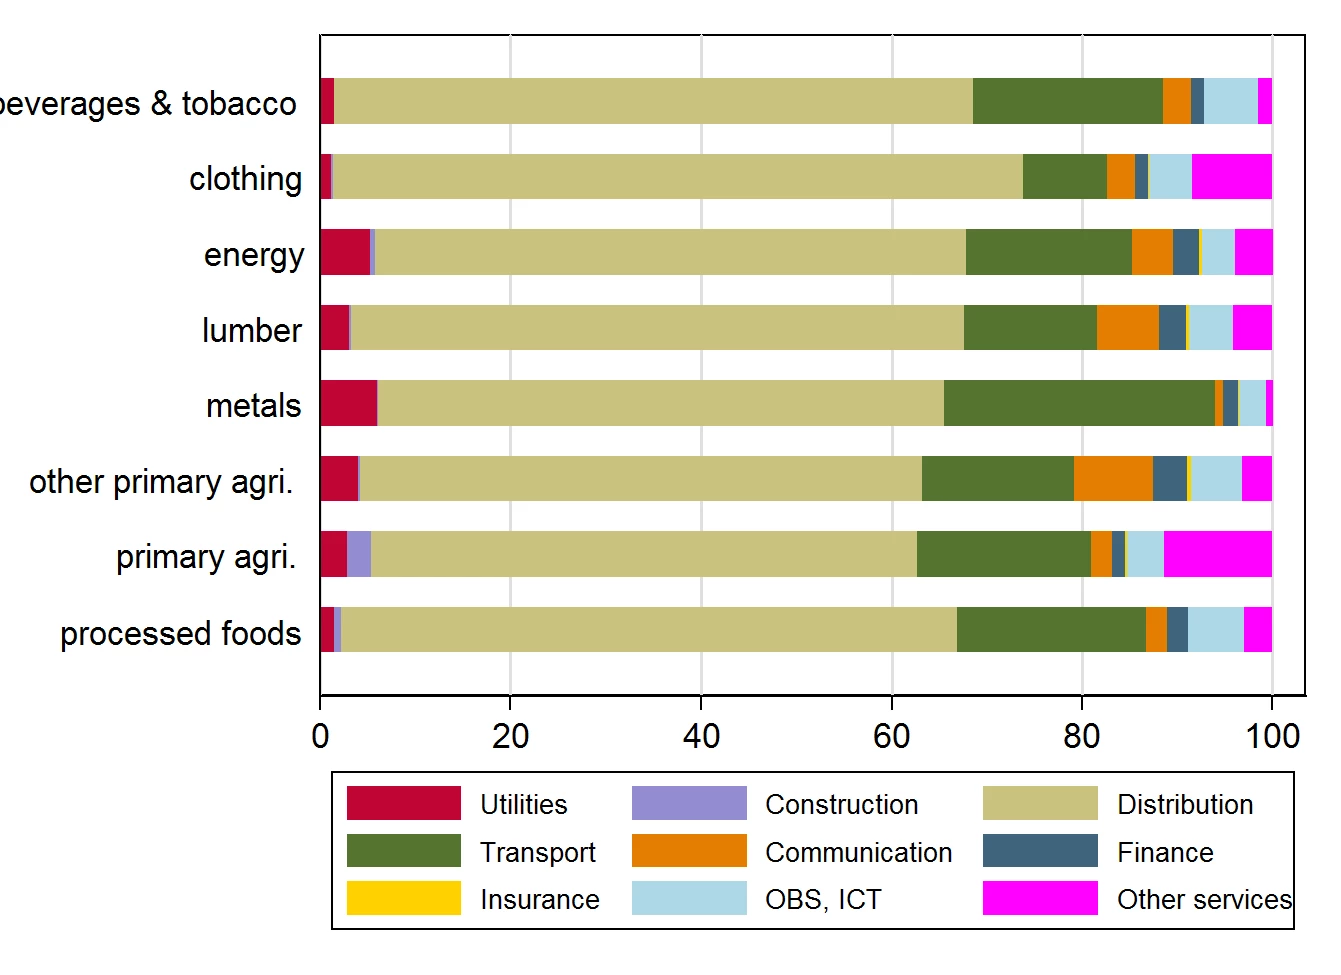
We can also look at the composition of services for other sectors’ exports. In Lao PDR, the structure of services inputs in manufacturing is fairly similar across the most important export sectors. However, the large majority of these services inputs are trade and transport. Finance, ICT and other business services are relatively less important.
Figure 3: Which domestic services support exports in Lao PDR, 2011

This information sheds light on how the interconnections between services with other sectors matter for exports. All this is essential to our understanding of export competiveness, and ultimately economic growth, in developing countries.


Join the Conversation