 Blurred silhouettes of cars surrounded by steam from the exhaust pipes. | © Shutterstock.com
The transport sector currently accounts for a quarter of energy-related carbon emissions globally. It also ranks among the fastest growing sources of such emissions. Economic development is associated with higher mobility and associated emissions, as households progress from mainly walking to relying on public transportation services, to acquiring their own two-wheel and, eventually four-wheel vehicles.
Little is known about the demand patterns for transportation services in developing countries and how these can be expected to shape emission trajectories over time. To design effective policies for the fight against climate change, it is important to understand the determinants and distribution of transport expenditures within developing countries, as well as the estimated impacts on CO2 emissions of increasing incomes.
A new research paper from the Infrastructure Chief Economist’s Office – Rising Incomes, Transport Demand, and Sector Decarbonization – presents new evidence on these issues, using it to address the following policy related questions.
How do transport demand patterns change as incomes rise in low and middle-income countries?
To begin with, many of the poorest people in the poorest countries do not register any expenditures at all on transportation, indicating that their mobility is essentially limited to where they are able to travel on foot. The percentage of zero-transport expenditure observations is very high in countries like Sierra Leone and Malawi (82% and 65% respectively), but declines steeply as per capita income rises, being null in a middle-income country like South-Africa for instance.
Transport expenditures as a percentage of household budgets vary, approaching 8% in low-income countries and exceeding 12% in high-income countries. However, variations across budget quintiles are even larger, with the poorest households dedicating just 5% of their budgets to transportation, compared with 15% for the richest households. There are also major variations across countries, with expenditure shares ranging from 3% in Tanzania to 22% in Honduras.
In addition, rural households spend relatively less than urban households, except in high income countries. The rural-urban household transport expenditure gap is largest in poorer countries and diminishes as countries get richer. For instance, urban households will spend on average twice more than rural households in low-income countries, 40% more in lower-middle income countries, and a similar share for other income groups.
Well over half of household expenditure on transportation goes to public transportation services, except in high-income countries, and in the richest quintile of households for low and middle-income countries. Indeed, expenditure on private transportation can be regarded as a luxury good, in the sense that budget allocations on cars rise twice as rapidly as a household’s overall spending. In contrast, public transportation behaves as a normal good, with budget allocated to buses (and equivalent shared services) rising at the same pace as overall spending.
What are the main determinants of vehicle ownership?
Underpinning these expenditure patterns is a marked expansion in the ownership of four-wheel vehicles as incomes rise. Doubling per capita income is found to increase the probability of vehicle ownership by 10 percentage points. In fact, the relationship between household budget and the probability of owning a car follows an S-shaped curve, which shows that as countries get richer, household budgets increase, and more households acquire cars. The probability of car ownership rises most steeply between per capita expenditure levels of $4,000 per year (equivalent to those found in Georgia) and $16,000 per year (equivalent to those found in Greece).
The intensity with which cars are driven is also strongly related to income, in that a one percent increase in per capita budget was found to increase miles driven by 0.5%.
Interestingly, motorcycle ownership patterns are more idiosyncratic, with ownership rates differing dramatically across countries, reflecting local preferences, based on factors such as culture, weather, and ready availability of vehicles. In particular, motorcycle ownership is particularly high – at 30-40% of the population – in Burkina Faso, Mali, Nigeria, and Pakistan.
What is the consequence of rising incomes for transport-related CO2 emissions?
Based on these findings, it is possible to project anticipated transport-related carbon emissions for individual countries given forecasts of income growth. Overall, the carbon footprint of the transport sector is anticipated to increase on average by 52% by 2035. The percentage increase ranges considerably across countries, ranging from around 25% in Mali to 175 percent in Sierra Leone.
These increases are attributable primarily to increases in first time car ownership, which almost doubles over this period. Motorcycle ownership is also projected to rise by more than 50%, however the impact on emissions is considerably smaller. While existing vehicle owners also expand their use by more than 50%, the impact is much smaller than that coming from the expansion of vehicle ownership.
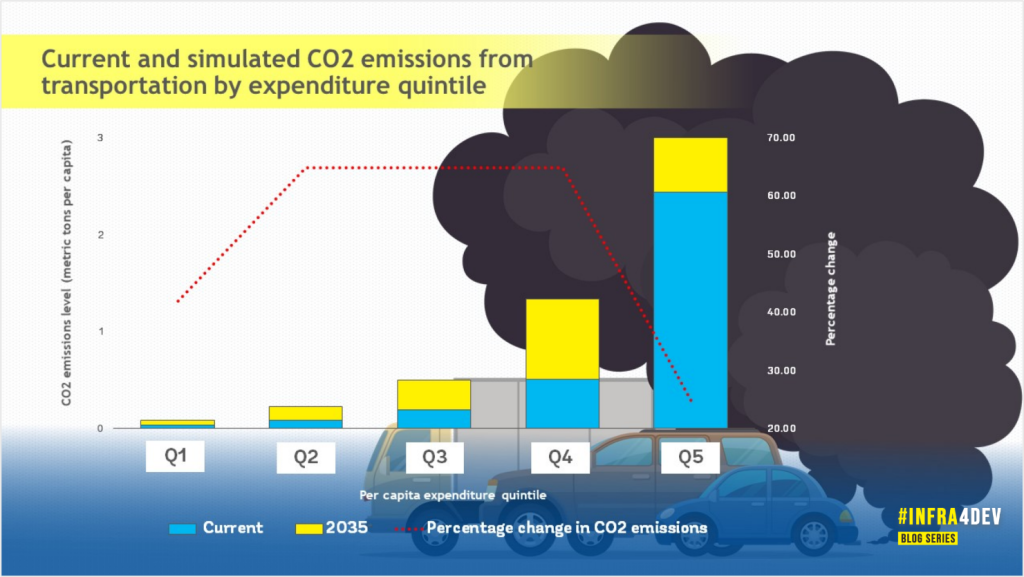
Transport-related carbon emissions are already highly concentrated among the richest, with the top budget quintile already responsible for more than twice as many emissions as all the remaining quintiles put together (see figure below). While the percentage growth of emissions for the top quintile is relatively low compared to the others, in absolute terms the additional emissions generated by those at the top of the distribution continue to exceed the growth in emissions from all other quintile combined. Overall, the inequality of transport-related carbon emissions is projected to increase in some countries, while decreasing slightly in others.
Figure 1. Current and simulated CO2 emissions from transportation by expenditure quintile
In conclusion, there is evidence of significant pent-up demand for transport services in low and middle-income countries. As incomes rise, households will become increasingly mobile, and car ownership will begin to rise steeply. All this is to be expected as part of the development process. However, unless transport systems are increasingly decarbonized, the growth in transport-related emissions from developing countries can be expected to be steep .
#Infra4Dev is a blog series that showcases recent World Bank economic research to explore how Infrastructure is critical for development. You can access to all the previous Infra4Dev blogs here.


Join the Conversation