
Reliable transport is critical to trade and development. But in many cases, there is little information about how much it actually costs to transport specific commodities around the world—a significant challenge for anyone trying to craft well-informed policies in area like climate or shipping. A new dataset developed by UNCTAD and the World Bank aims to fill the gap.
International transport is a key enabler of global trade and therefore of the economic development of countries. Yet, the costs of transporting commodities vary widely across countries, routes, directions and commodities. Often, small island developing States (SIDS), landlocked developing countries (LLDCs), and least developed countries (LDCs) spend more than average on the international transport and insurance of their merchandize imports. This variation in transport costs levels—as illustrated by Figure 1—is due to a wide range of factors: distance and geographical location, size of the economies and markets, scale effects, market structures, connectivity to transport networks, cross-border trade efficiency, infrastructure availability and quality—to name just a few.

Building the evidence base for informed policymaking
Measuring and understanding the differences in international transport costs will be essential in improving countries’ development outcomes. This is especially true in the current context, where global needs like cutting emissions from transport or responding to the COVID-19 crisis are likely to transform the industry in a fundamental way.
Take the shipping sector, for instance. Maritime transport currently carries more than 80% of global trade by volume, and plays a critical role in the supply of essential goods such as food, clothing, shelter, and pharmaceuticals to countries. Yet, the carbon footprint of shipping already accounts for almost 3% of global greenhouse gas (GHG) emissions, and is expected to grow even further in the coming years without effective policy intervention. To address this, the International Maritime Organization (IMO) is now working to decrease emissions from ships by at least 50% by 2050 compared to 2008 levels—as defined by the IMO Initial GHG Strategy from April 2018.
How will this impact international transport costs? What are the potential implications for people and economies? More broadly, how can we reduce the climate impact of international transport while maximizing its economic and social benefits?
This is precisely the type of questions that the United Nations Conference on Trade and Development (UNCTAD) and the World Bank had in mind when they decided to collaborate on a new Global Transport Costs Dataset for International Trade, with a special focus on international maritime transport. Launched just a month ago, the dataset’s ambition is to cover a broader range of countries and provide more detail than existing datasets on international transport costs. This work has added another important piece to the global transport costs puzzle, and will help close a persistent data gap faced by policymakers, researchers, and transport industry stakeholders.
A more global and granular way to look at international transport costs
In the context of the IMO Initial GHG strategy, the new Global Transport Costs Dataset for International Trade allows policymakers and researchers to assess the expected impacts of specific GHG reduction measures for ships on transport costs among a broad range of export or import commodities between various countries. By displaying the transport costs in a multi-dimensional format, users can compare the transport costs across country pairs, commodities, and, most importantly, five transport modes (sea, air, railway, road, and non-standard such as pipelines, powerlines, etc.). This is expected to provide valuable input for the development of detailed impact assessments which seek to examine how any climate policy for shipping may impact international trade and economies of states, for instance.
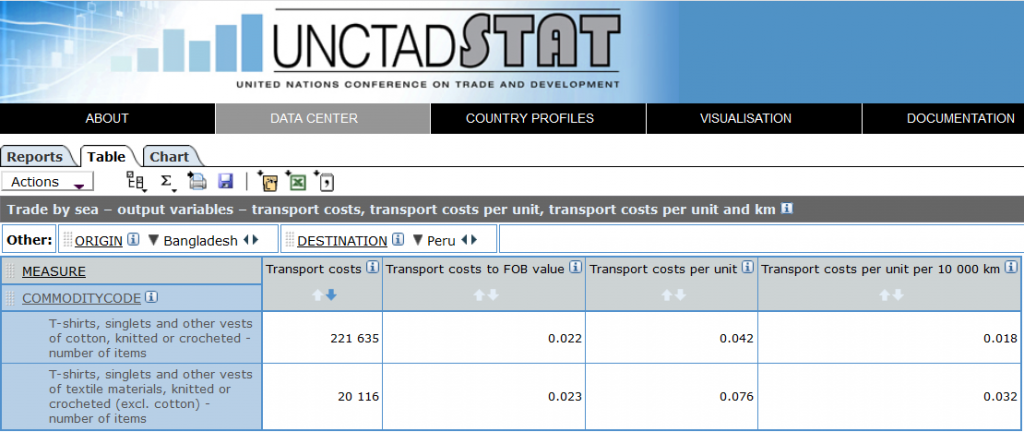
By way of example, Figure 2 illustrates the costs of transporting T-shirts by sea from Bangladesh to Peru. Here the dataset provides total transport costs, transport to Free On Board value (that is, transport costs relative to the merchandise value of the good), transport costs per unit and transport costs per unit and distance.
Drawing on new trade data more and more disaggregated by mode of transport in the United Nations’ Comtrade Plus portal, the dataset leverages models and auxiliary data to develop additional projections of transport costs, even when country-level data is lacking. This includes for example the use of a specific mode-choice model, quantity-value model and transport-costs model as well as mirror data and trend data. Thanks to this approach, the dataset currently provides the most extensive coverage of any transport costs dataset publicly available, with information from over 105 importing countries and over 200 exporting countries, representing around 95% of global merchandise trade in terms of value.
Additionally, the dataset has been linked with an interactive map that enables users to easily visualise the flow of commodities and their related transport costs between country pairs—as illustrated by Figure 3 with pharmaceuticals being imported to Madagascar from the country’s top 10 trade partners. For researchers interested in downloading the underlying tables, UNCTAD provides the option for bulk downloading.

A system that allows for expansion and improvements over time
The dataset seeks to use the most recent data available. While the first version of the dataset and the interactive map still covers 2016 data only, this initial phase has allowed UNCTAD and the World Bank to set up a robust methodological framework and technical system for measuring international transport costs. This will enable continuous improvement and enhancements in data quality, timeliness, and completeness in the coming months and years.
Over time, our objective is to further refine the dataset, especially by including data from more countries over a wider time range. The dataset will then be updated and reviewed on an ongoing basis to make sure it brings the highest possible value to policymakers, researchers, and to anyone who is interested in making a difference in the field of transport and climate.
In that spirit, we welcome your feedback on the usefulness and usability of the dataset, as well as any other suggestions you may have for us!
The dataset has been jointly developed by UNCTAD and the World Bank. Equitable Maritime Consulting has provided technical support, especially with regard to the estimation of modal shares of major transport modes.
Given the special interest in maritime transport, the work has been kindly supported by PROBLUE, a multi-donor trust fund housed by the World Bank in support of the development of integrated, sustainable and healthy marine and coastal resources.
The present blog post builds on an article previously published in the UNCTAD Transport and Trade Facilitation Newsletter No. 88, and co-authored by Nour Barnat, Jennifer Brown, David Cristallo, Goran Dominioni, Dominik Englert, Ronald Apriliyanto Halim, Jan Hoffmann, Onno Hoffmeister, Nicholas-Joseph Lazarou, and Wendela Schim Van Der Loeff.


Join the Conversation