Medical emergencies are often a race against time. For instance, cases of severe trauma require rapid treatment in order to ensure a realistic chance of survival. An efficient ambulance service can ensure that patients receive rapid on-site treatment or are taken quickly to the nearest hospital. In many high-income countries, average ambulance response time for life-threatening emergencies is now just over five minutes. But what happens in places in less developed communities where roads are frequently flooded and impassable?
Indeed, a fast response relies not only on an effective emergency management system that optimizes the dispatch and routing of ambulances. It is also the quality and resilience of infrastructure systems that ensure connectivity and fast travel times. Urban floods – a common occurrence for many people around the world, from Amman, Buenos Aires, and Dar es Salaam to Jakarta and Mumbai – frequently force traffic to a standstill. Across the city, firms and households suffer as supply chains are disrupted and the access to jobs and services is obstructed. Even more serious is the impact of floods on a city’s ability to treat life-threatening emergencies.
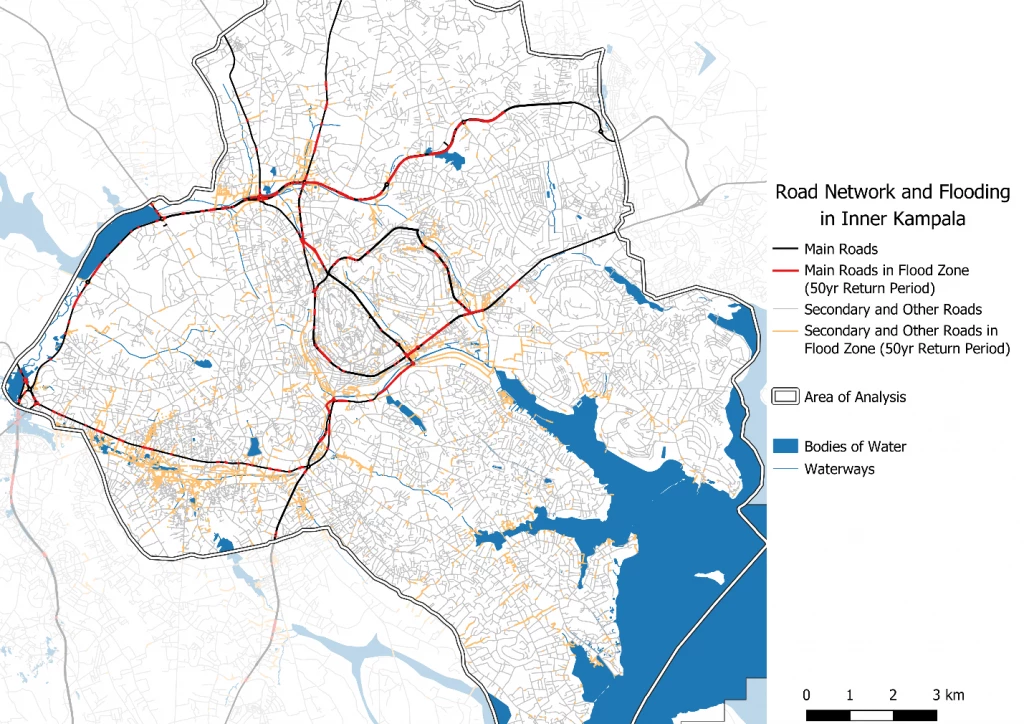
Lifelines, a recent report by the World Bank and GFDRR, shows how open access data and new network analysis tools can help us better understand and address this challenge. For instance, in Kampala, Uganda, flooding can affect critical sections of the urban road network. A Lifelines background paper estimates that a flood with a 1 in 50 year intensity could inundate about 11km of main roads (or about 10% of the primary road network), and another 45km of secondary and residential roads in Inner Kampala (Figure 1).

As roads are flooded, road users have to find alternative routes. This will inevitably increase travel times and cause significant delays in some cases. When such delays affect emergency response services, even moderate flooding can become a matter of life and death.
Indeed, a network analysis shows that the consequences of flooded roads can be severe even in neighborhoods that are not directly affected by the flood. Using an algorithm similar to Google Maps’ trip planner, we systematically compute the optimal travel route and time from every part of Kampala to the city’s health care facilities.
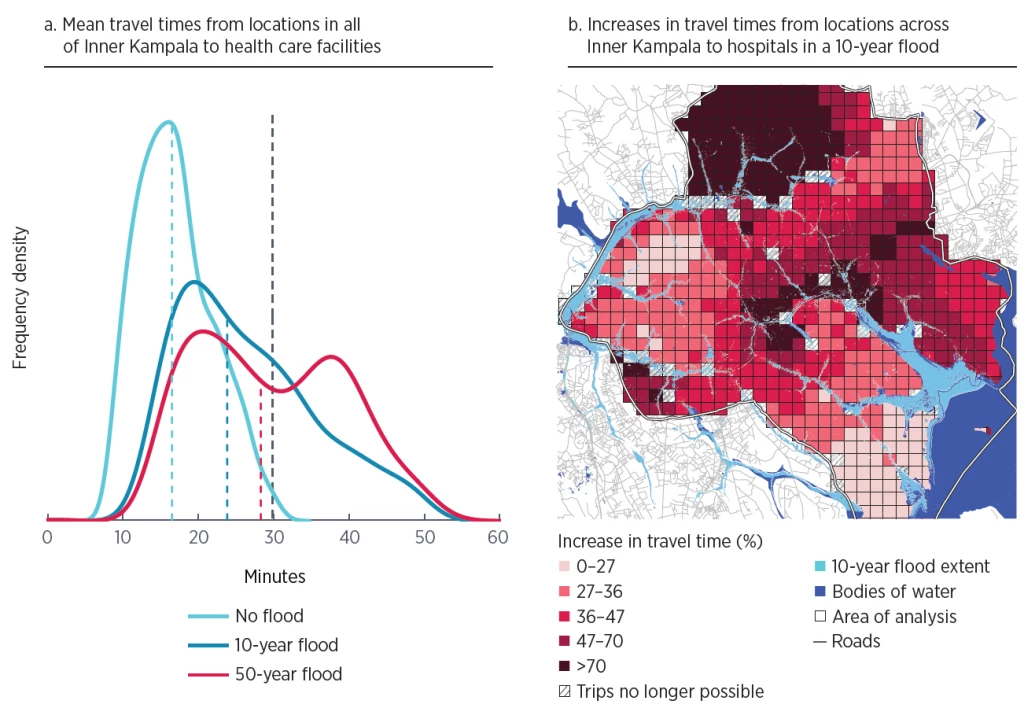
Under ideal conditions health care facilities can be accessed relatively quickly from most parts of the city, taking about 15 minutes on average. This means that an ambulance could complete a return trip from a hospital to an emergency site in about 30 minutes. However, when we consider a relatively minor flood, there are vast parts of the city where travel times to hospitals would increase significantly – for some areas travel times would more than triple, while others could be cut off entirely (Fig 2). While these results are modelled for a flood with a 1 in 10-year likelihood, the evidence shows that floods that occur several times a year can cause similar levels of disruption.

The good news is that flood risk modeling tools can help us identify targeted measures to improve access for the most critically affected neighborhoods. These tools can, for example, help decide on locations for new health care facilities in a way that ensures access even during the rainy season. They can also be used to identify the most critical links in the urban road network, and thus to prioritize infrastructure upgrades and investments in resilient roads.
Similarly, stress-testing the flood resilience of the road network can help optimize the location of cyclone shelters, or improve the accessibility of jobs – often a key bottleneck to prosperity in many Sub-Saharan African cities.
While network analysis has been a familiar concept for many years, its implementation was typically labor- and time-intensive. Thanks to new and openly available data science tools – some of which were developed at the World Bank – accessibility models can now be developed from OpenStreetMap quickly and cost-effectively.
Do you have ideas how these tools could help address challenges in your city or region? Leave us a comment!
Related Links:


Join the Conversation