More than half of the world’s extreme poor live in Sub-Saharan Africa. Yet, several African countries have recently made impressive gains in reducing poverty. Which countries have been able to make the most progress in reducing their extreme poverty rate, defined as the percentage of people living on less than $1.90 per day? And have these countries seen similar improvements in other important measures of economic well-being?
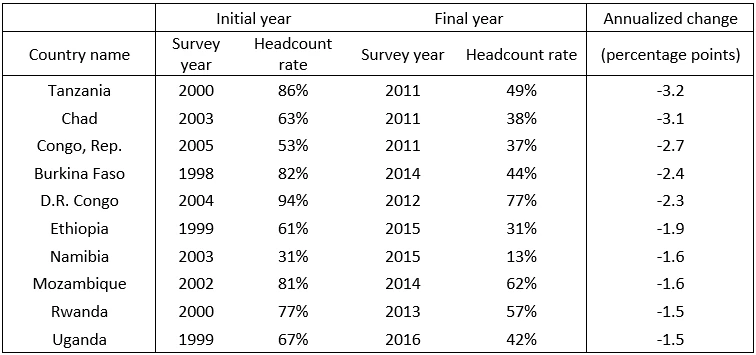
Figure 1 presents the countries that achieved the most rapid reduction in extreme poverty, measured as the annual percentage point change in the international extreme poverty rate, circa 2000 to circa 2015. By this measure, Tanzania reduced extreme poverty the fastest in Sub-Saharan Africa. It reduced extreme poverty from 86% in 2000 to 49% in 2011, cutting its extreme poverty rate by 3.2 percentage points per year. This is about three times the pace of the average country in the region. Chad and the Republic of Congo ranked second and third and lowered their poverty rates by 3.1 and 2.7 percentage points per year respectively during this period.
Poverty in Africa is heavily concentrated in a few countries. Over 70 percent of the region’s poor people live in just 10 countries—Nigeria, D.R. Congo, Ethiopia, Tanzania, Kenya, Madagascar, Kenya, Mozambique, Uganda, and Malawi. Fortunately, of the 10 countries with the largest number of poor, five are among the fastest poverty reducers listed in Figure 1. Overall during this period, the 10 countries listed in Figure 1 have combined to lift over 13 million Africans out of extreme poverty.
Monetary poverty in Sub-Saharan Africa is based on household consumption and only represents one of many aspects of peoples’ economic well-being. The World Bank’s Multidimensional Poverty Measure (MPM) is an index that combines monetary poverty with additional welfare measures. Since the MPM was only recently introduced, it is not yet possible to examine trends over time. As an alternative, we look at two components of the MPM for which data are reported in the World Development Indicators: The share of primary-school-age children in school, and the share of the population with access to electricity.
Figure 2: Trends in alternative measures of well-being
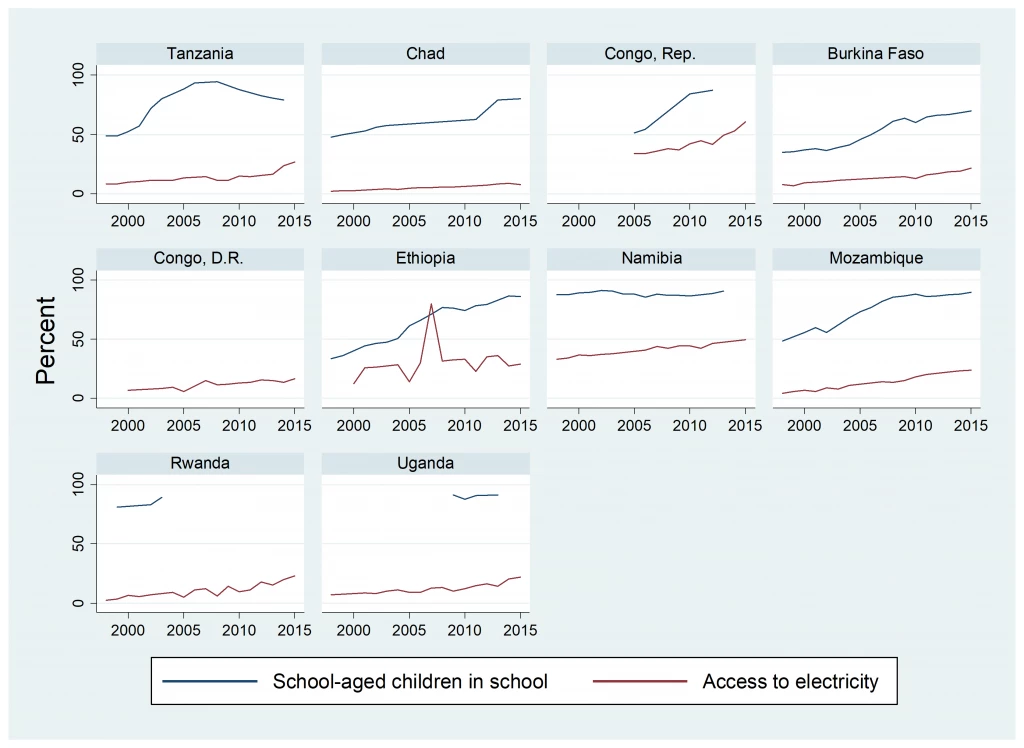
In general, the top reducers of extreme poverty have also seen progress in improving these two non-monetary measures of well-being, as seen as Figure 2. Unfortunately, we do not yet know whether the countries that have reduced monetary poverty the fastest also experienced the largest improvements in the MPM, or its other components such as improved water and sanitation or the educational attainment of adults. Going forward, continuing the World Bank’s investment in harmonizing and managing its unique collection of survey data will allow us to better monitor trends over time in multiple aspects of poverty and well-being.
Supplementary table
Source: PovcalNet September 2019 version
Selection of countries:
Data was extracted from the September 2019 version of the PovcalNet database.
We considered 32 countries in Sub-Saharan Africa with at least one poverty estimate from between 1995 and 2005 and another between 2010 and 2019. Guinea, The Gambia, and Niger are not considered because their reported monetary poverty measures are not comparable during this period.


Join the Conversation