With nearly half of the population (or approximately 8 million people) living in extreme poverty, Burkina Faso is poised to make inroads in the long and challenging journey to achieve the World Bank Group's overarching twin goals: ending extreme poverty in 2030 and boosting shared prosperity. Every fiscal year since 2015, the Bank has committed more than 300 million dollars of IDA resources in support of development projects in Burkina Faso. The World Bank has also provided a set of timely analytical and advisory services to inform national development strategies and policies in the country.
The question is whether (and how) the Bank's investments have helped the country achieve the twin goals.
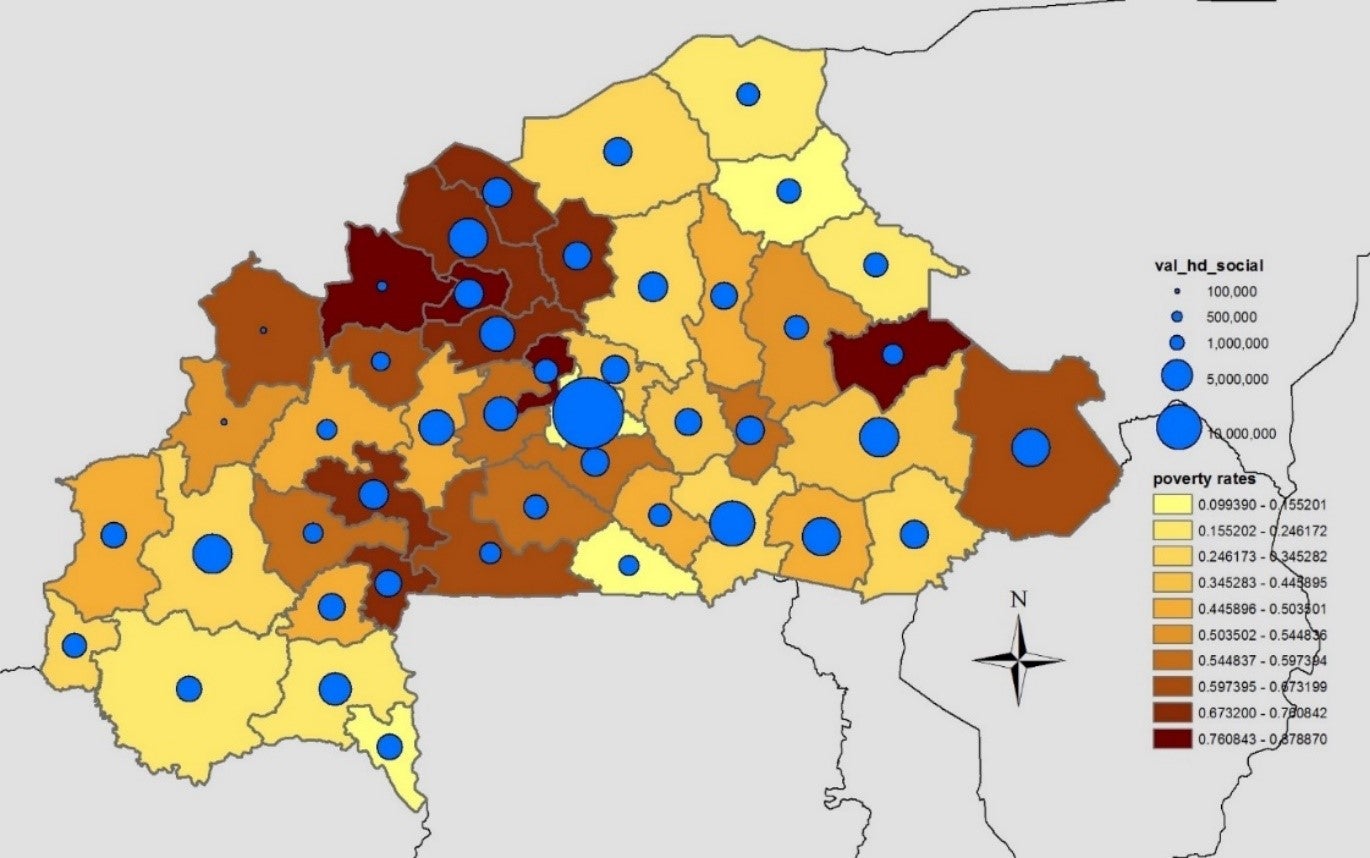
To prepare for the Country Partnership Framework for Burkina Faso, we examine the poverty footprint of different types of Bank's projects, based on findings from the recent report by the Poverty and Equity Global Practice on spatial inequality of welfare.
Why assessing the poverty footprint of Bank's operations?
Two reasons:
- it gives a critical assessment of the Bank's performance in terms of how it reaches the poor, and
- it provides a useful tool to identify missed opportunities. Is there any location with a large number of the poor but currently low levels of the Bank's investments? Similarly, is there any lagging location where the Bank's projects have not yet covered?
What did we find?
- Overall portfolio
The majority of the Bank's investments in Burkina Faso indeed concentrates in the three growth poles of the country (Map 1 above): Kadiogo where the capital Ouagadougou is located, Houet province which houses the second-largest city, Bobo-Dioulasso, and Boulgou province where the Bagre growth pole is situated. Compared to other provinces, these three provinces, especially Houet, have a relatively large number of the poor.
- By types of projects
To get more insight on whether and how the Bank's investments effectively and efficiently reach people in need, we need to be mindful of both the types and locations of the projects. First, people's priorities may vary by locations (dense vs. remote areas) as their jobs, demographics, and access to basic services differ, thus, they may prioritize one type of projects over another. In addition, costs of projects are likely to vary by types and locations as well.
Projects with high fixed costs (i.e. infrastructure) tend to aggregate in locations with a large concentration of the poor to maximize the coverage and minimize the cost per user. In Burkina Faso, investments in infrastructure, such as transport modernization, urban water, electricity, etc. also appear to concentrate in the three growth poles, Kadiogo, Houet, and Boulgou provinces. In fact, the geographic footprint of Burkina Faso portfolio is mostly driven by the spatial pattern of the infrastructure projects.

When we consider the Bank's investments in portable assets such as health and education, as well as social safety nets, it appears that the Bank achieves an equitable distribution of investments across all provinces, including the poorest. This is, in fact, a positive signal that the Bank is reaching the lagging regions and is on the right path toward the twin goals.

What's next?
What we did here is one of many ways to assess the poverty footprint of the Bank's projects. Here are some other ideas.
- The Bank's investments could be categorized differently, by the country's national priorities, by thematic groups, etc.
- Various dimensions of poverty could be used, depending on the nature of the projects. For example, poverty rates, poverty gap, severity of poverty, or number of the poor may be useful for social safety net projects. Poverty rates and number of the poor per square kilometer may be useful for infrastructure projects (electricity, water, etc.). The list goes on.
Now, how does the poverty footprint of the Bank's investments in your country look like?


Join the Conversation