The flow of Foreign Direct Investment (FDI) to Africa has shifted over the past decade, as new sources of investment have emerged and new sectors have expanded. While the COVID-19 crisis has clouded the outlook for future investment, capitalizing on the longer-term trends presents a compelling opportunity for African policy makers looking towards economic recovery.
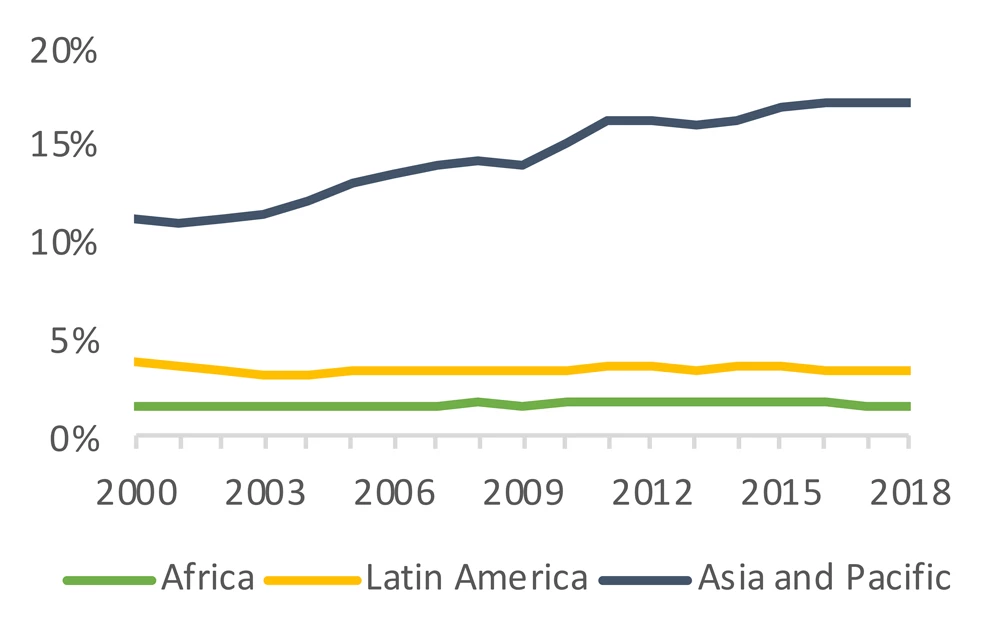
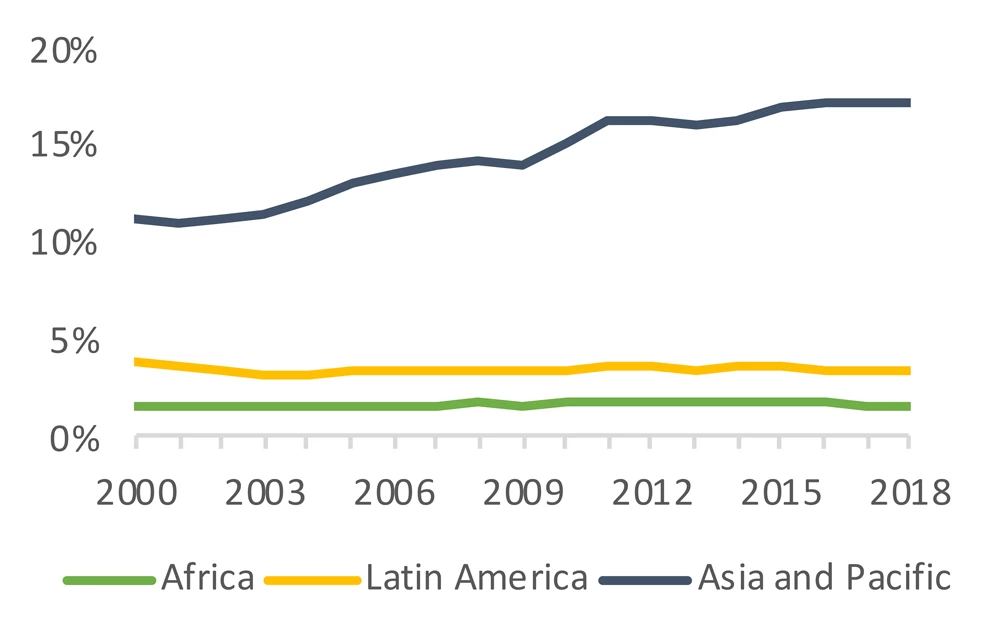
Low foreign investment has held back Africa’s participation in global value chains (GVCs). FDI is beneficial to the host countries because it helps to enhance firm productivity and integrate domestic firms into global markets, as illustrated by the rapid development of newly industrialized Asian economies in the last few decades. Unfortunately, both FDI inflows and GVC participation are low in the Africa region (Figure 1.1 and Figure 1.2).
In 2000, Africa only attracted 1% of global FDI inflows, and raised it to 3% by 2018. Yet its share of global GVC participation remained constant during this time at 2%. In contrast, developing countries in the Asia-Pacific region increased their global FDI share from 10 to 31% , and raised their GVC participation share from 11 to 17% during this time. Hence, compared to other regions, Africa’s FDI and GVC integration are still underdeveloped.
Figure 1. FDI inflows and GVC participation
| 1.1. Total share of global FDI inflows | 1.2. Total share of global GVC participation |
 |
 |
Source: Authors’ calculations using UNCTAD FDI and EORA Statistics.
Note: For Africa, Latin America and Asia-Pacific, only GVC participation and FDI inflows for developing countries are reported.
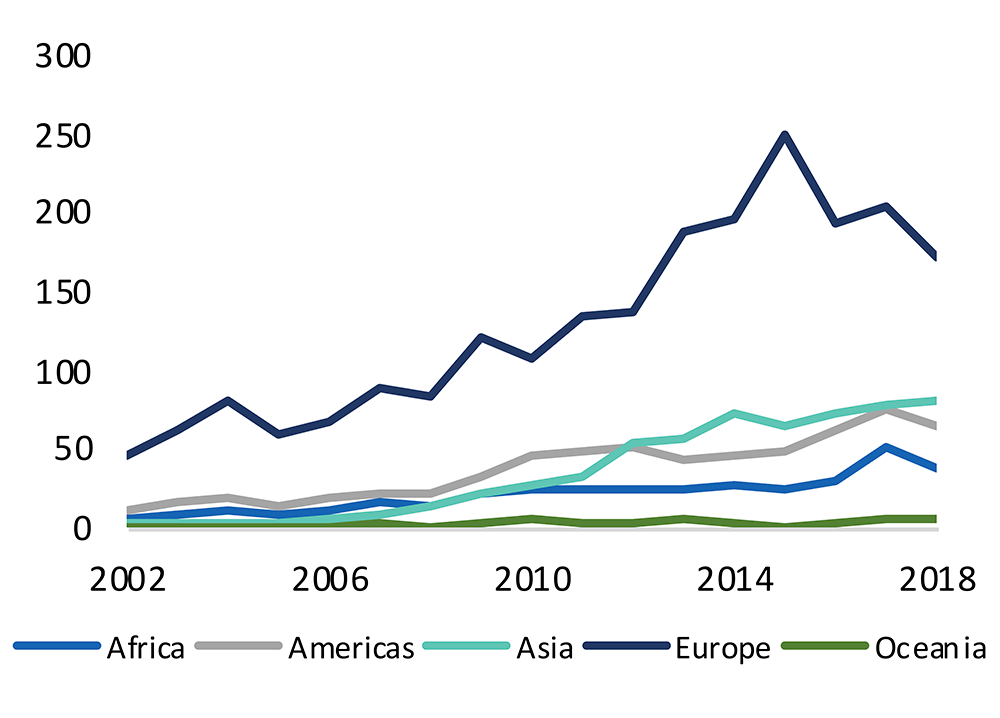
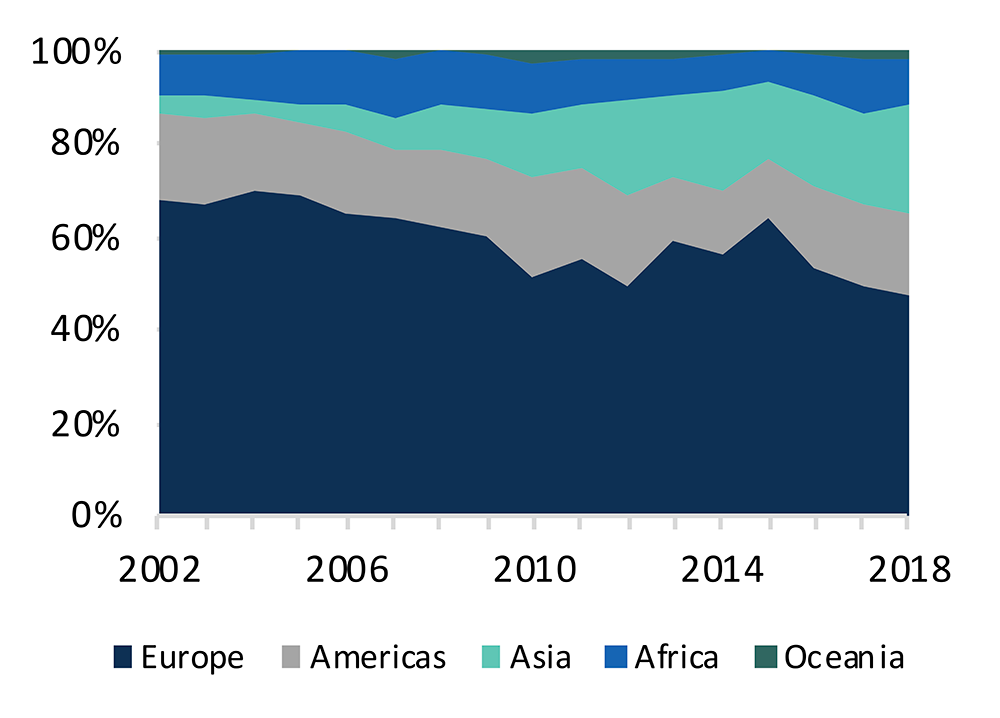
There has been a steady increase in FDI from Asia and Africa. Historically, Europe has been the dominant source of Africa’s FDI, making up two-thirds of its FDI stock until 2005. While its absolute value grew, its share has fallen since then to below 50% in 2018 (Figure 2.1 and Figure 2.2). In its place, FDI from Asia has increased, whose share grew from 5% in 2002 to 23% in 2018. A primary driver is China, whose FDI accounts for almost half of Asian FDI in the region. Recent evidence highlights the impact such Chinese FDI has had on Africa’s economic growth. Intra-African FDI also rose from 9% in 2002 to 13% in 2017.
Figure 2: FDI in-stock by source region
| 2.2: Value of FDI stock (US$b) | 2.1: Share of total FDI stock in SSA |
 |
 |
Source: Authors calculations using World Bank Group harmonized bilateral FDI database.
Note: Eastern Africa data excludes FDI to and from Mauritius as it operates as a major offshore financial center. Most of its FDI flows through the country but does not reside in the country. Separating out such FDI flows is extremely difficult and therefore the convention is to present FDI data without flows to and from offshore financial centers.
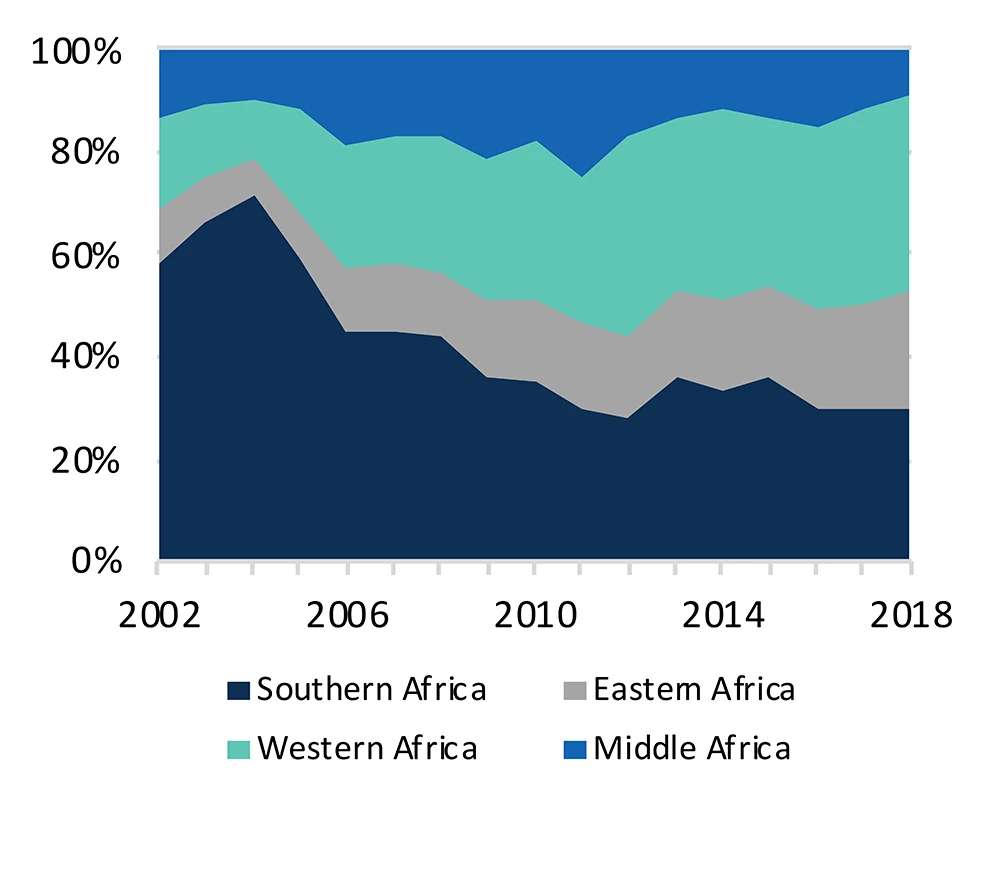
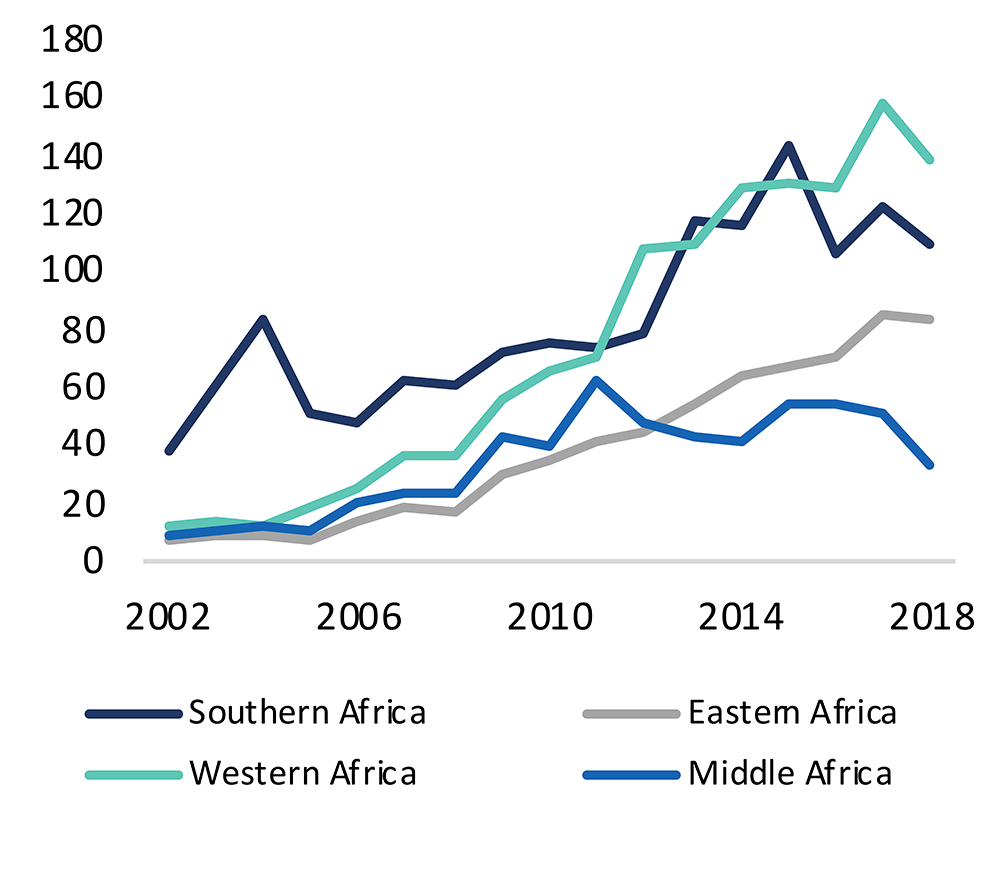
There have also been major changes in the destinations for FDI. Southern Africa (especially South Africa) has historically been the main destination for FDI, hosting more than 70% of all FDI in the region in 2004 (Figure 3.1). Yet, by 2018, it represented only 30% of FDI stocks by 2018. This is because FDI in other parts of the continent grew, most notably in Western Africa (led by Nigeria), where FDI stock increased from 15% in 2002 to 36% in 2018. Eastern Africa also saw an increase in FDI (Figure 3.2).
Figure 3: FDI in-stock in SSA by destination sub-region
| 3.1: Share of total FDI stock in SSA | 3.2: Value of FDI stock (US$b) |
 |
 |
Source: Authors calculations using World Bank Group harmonized bilateral FDI database.
Note: Eastern Africa data excludes FDI to and from Mauritius as a major offshore financial center (see note figure 2).
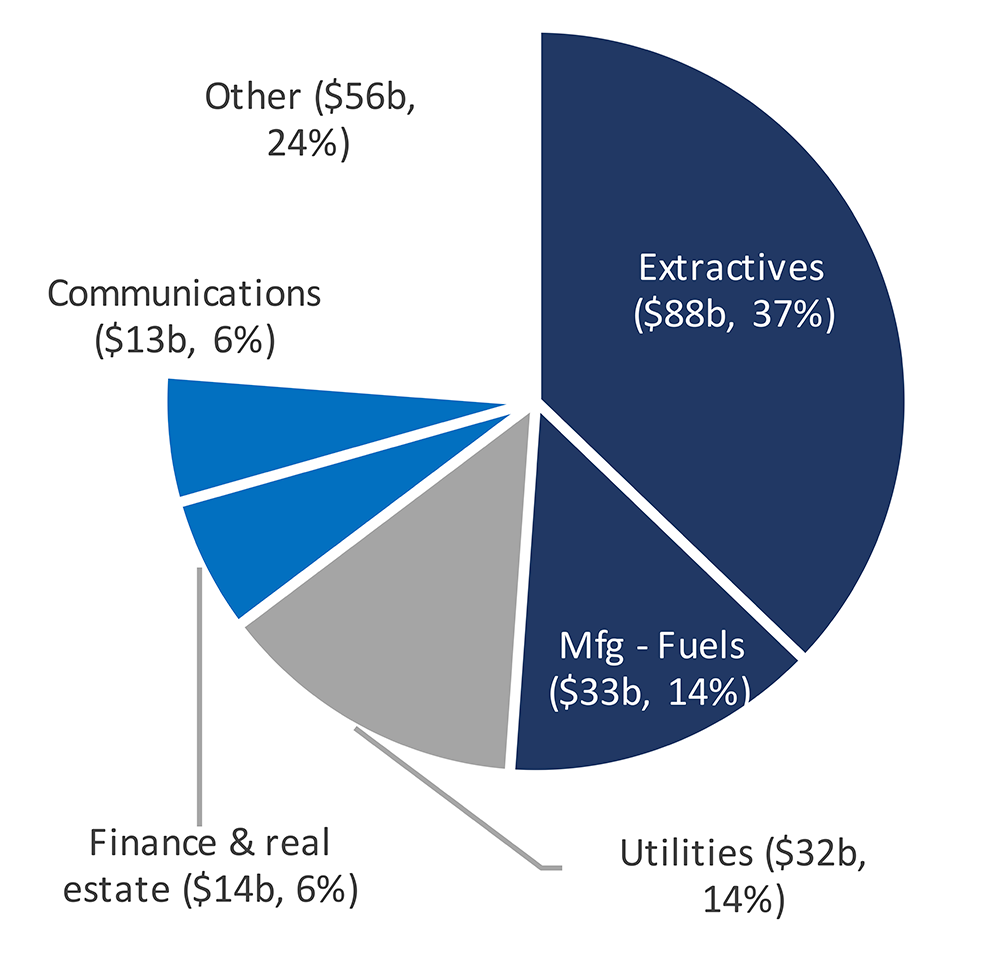
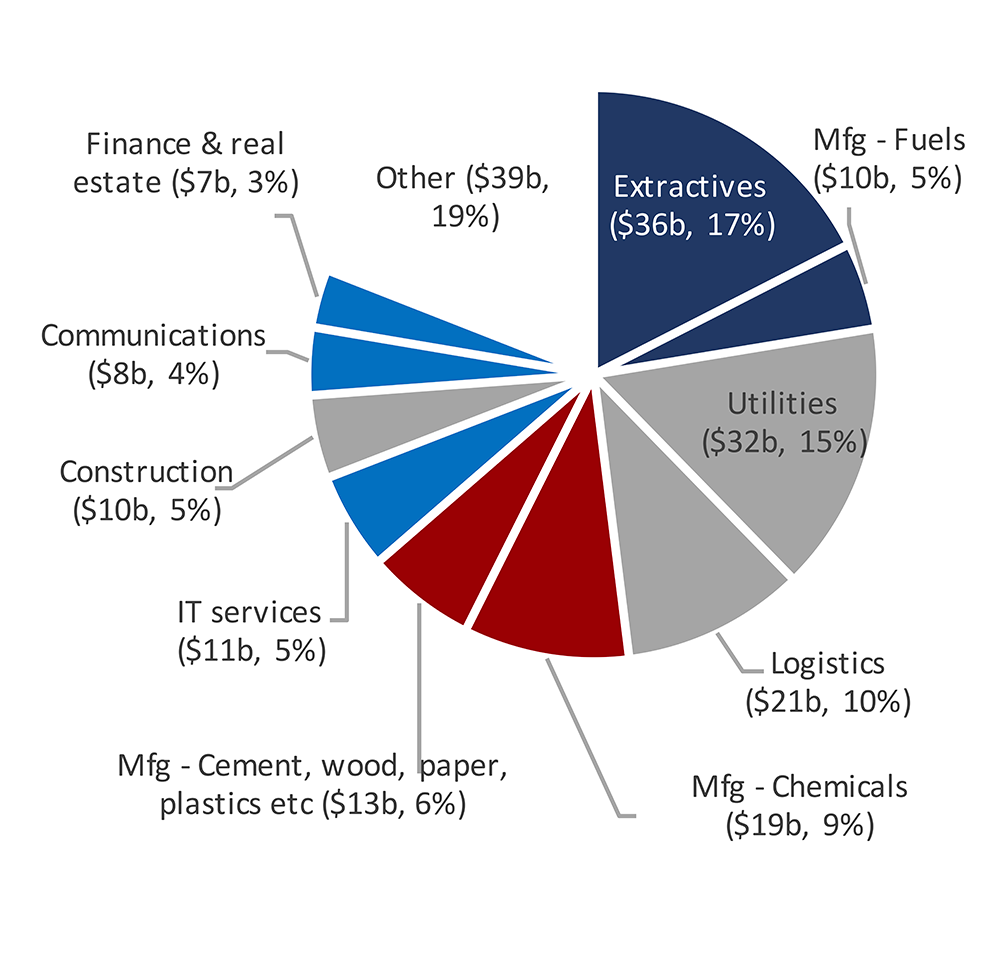
New investments have been increasingly diversifying from raw materials into manufacturing and services. Between 2006 and 2010, resource extraction, petroleum and coal processing projects made up more than half of the estimated $236 billion greenfield FDI projects announced in Africa (Figure 4.1). Yet, between 2016 and 2020, new projects in these sectors accounted less than a quarter of the total (Figure 4.2). Sectors that have attracted significant new investment in the recent period include logistics, communications and IT services, chemicals, and renewable energy (which makes up more than half of utilities investment, up from around 20% in the earlier period).
Figure 4: Announced greenfield FDI projects in Sub-Saharan Africa, by sector (US$ billion)
| 4.1: 2006-2010 | 4.2: 2016-2020 |
 |
 |
Source: Authors calculations using fDi Markets.
Note: dark-blue includes coal, oil & gas and metals, red captures manufacturing sectors, and grey reflects service sectors.
Unfortunately, COVID-19 significantly disrupted FDI to Africa. FDI flows globally were already in decline when the pandemic struck. Greenfield FDI announcements declined rapidly in the second and third quarter, before rebounding slightly in the fourth quarter of 2020 (Figure 5). Overall, new announcements in 2020 were down 56% from 2019. Such declines occurred across nearly every major sector.
Figure 5: Impact of COVID-19 on Greenfield FDI Announcements in Sub-Saharan Africa

FDI has a key role to play to help Africa achieve a rapid economic recovery from COVID-19. For this to happen, Africa needs to attract more foreign investment, and ensure that it occurs in more employment-intensive, export-oriented or green sectors. The continent saw promising new developments on both fronts before the pandemic, and should continue to improve their domestic investment climates, adapt to possible new priorities in investment policy and promotion, and strengthen regional collaboration (as through the African Free Continental Trade Agreement).


Join the Conversation