 Three-dimensional logos of tech giants: Amazon, Apple, Facebook, Google and Microsoft against concrete wall. | © Adobe Stock
Big tech companies across the world have started to offer lending services in recent years, either directly or in partnership with financial institutions. In China, Alibaba, Baidu, and Tencent all offer credit services through their subsidiaries, while in the United States, Apple, Amazon, and Google also offer credit services. Aided by advantages in information, distribution, technology, and monitoring embedded in these big tech companies’ ecosystems, the global volume of big tech lending grew rapidly from $10.6 billion in 2013 to $572 billion in 2019, more than twice the volume of other types of fintech lending.
Is big tech lending riskier than traditional bank lending? Is big tech lending robust to severe economic shocks that may create structural breaks in its risk assessment models? How do big tech lenders structure loans? And for what do borrowers use big tech loans? These questions represent financial regulators’ key concerns about big tech lending. We study these questions by comparing big tech business loans made by the syndication of MyBank with a large retail bank in China, Bank X hereafter, and Bank X’s regular and online business loans from August 2019 to December 2020. MyBank is a pioneer big tech lender to small and medium-size enterprises in China.
We find sharp differences between big tech lending and Bank X’s lending in many aspects. Big tech borrowers have more limited credit access and 81 percent of them obtained their first business loan from a big tech lending program . Big tech loans are mostly uncollateralized, with much smaller credit limits and loan sizes, and much higher interest rates.
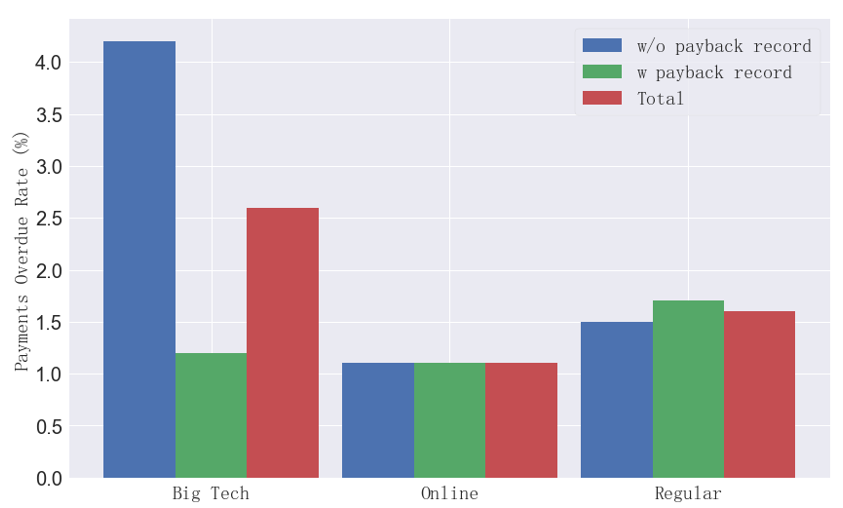
We focus on uncollateralized loans in our analysis. Consistent with big tech loans’ coverage of borrowers with worse credit quality, the overall delinquency rate of big tech loans is higher than that of Bank X’s loans, as figure 1 shows. Yet, the higher delinquency rate is mainly driven by borrowers without a payback record, which accounted for nearly half of the big tech loans. Among big tech loans made to borrowers with a payback record, the delinquency rate was only 1.2 percent, very similar to that of Bank X’s loans.
Figure 1: Rate of Payments Overdue
This figure presents the fraction of payments ever overdue by at least 30 days by whether the borrower had at least one payback record from the corresponding lending program.

We analyze the delinquency rates of loans that originated before and after the start of the COVID-19 shock in China in February 2020. The findings show that the delinquency rates of big tech loans remained stable, even slightly reduced, relative to Bank X’s regular loans after the onset of the COVID-19 pandemic. The big tech lending program remained robust in both loan supply and interest rates. These findings show the robustness of big tech lending to a severe economic shock.
How can a big tech lender channel credit to borrowers with worse quality without incurring excessive risks (even during the COVID-19 period)? The speed of repayment provides some clues. The loans in our sample have maturities of either six months or one year. From table 1, big tech loans tend to be repaid far before the maturity date and substantially earlier than Bank X’s loans. The 25th percentile of the ratio of repayment time to loan maturity is only 4 percent for the big tech loans. The fast repayment suggests that borrowers are likely to use big tech loans to meet short-term liquidity needs rather than as long-term financing, which in turn limits the big tech lender’s exposure to borrower risk. Interestingly, the high interest rates of big tech loans help to screen borrowers with short-term liquidity needs who expect to pay back fast. Due to the fast repayment, the interest expense–to–loan size ratio of big tech loans is similar to that of Bank X’s loans, and the big tech loans’ interest cost is even lower due to the smaller loan size.
Table 1: Distribution of the Ratio of Repayment Time to Loan Maturity
This table reports the distribution of the ratio of payback time to loan maturity.
| N | Mean | Std. | Min | 5% | 10% | 25% | 50% | 75% | 90% | 95% | Max | |
| Big Tech |
515,711 | 0.46 |
0.44 |
0.00 |
0.00 |
0.01 |
0.04 |
0.28 |
1.00 |
1.00 |
1.00 |
11.13 |
| Online |
74,921 | 0.74 |
0.37 |
0.00 |
0.03 |
0.10 |
0.48 |
0.96 |
1.00 |
1.00 |
1.00 |
18.48 |
| Regular |
21,253 | 0.77 |
0.32 |
0.00 |
0.06 |
0.18 |
0.60 |
0.93 |
1.00 |
1.00 |
1.00 |
2.54 |
We further isolate the differences in lending programs by examining a small set of big tech borrowers with access to Bank X’s regular or online loans. As these overlapped borrowers have better credit quality and outside options than other big tech borrowers, it would be expected that they would have loans with better terms. It is surprising that the big tech lender offers them similarly high interest rates and low credit limits, suggesting that it is not directly competing with banks for these higher quality borrowers. Again, big tech loans are repaid much faster than Bank X’s loans, suggesting that borrowers in this overlapped sample also use big tech loans to fulfill short-term liquidity needs. Interestingly, 57 percent of the big tech loans in this sample were taken when the borrowers had cheaper and sufficient credit lines available from Bank X, revealing the advantage of big tech lending in other aspects, such as convenience. Such convenience, in combination with high interest rates, helps the big tech lender to attract borrowers with short-term liquidity needs, limiting its exposure to borrower risks.
When focusing on the borrowers from the overlapped sample, big tech loans have lower delinquency rates than Bank X’s loans. In addition, overdue borrowers who are delinquent on at least one type of loan ex post obtain smaller credit limits, smaller loan sizes, and higher interest rates from the big tech lender. These results confirm the information advantage of the big tech lender, and help to explain the better risk performance of big tech loans.
Overall, our findings motivate a nuanced view of the restrained advantages of big tech lending: big tech lenders may have unique advantages in providing credit services to a set of borrowers that are underserved or unserved by traditional banks, but such credit services target the borrowers’ short-term liquidity needs rather than long-term financing needs, inside big tech lenders’ ecosystem. This big tech lending model—by design—does not compete directly with traditional banks for the full spectrum of credit services, in contrast to a compelling view of big tech lenders using their advantages in data and technology to monopolize the origination and distribution of loans to consumers and small and medium-size enterprises.


Join the Conversation