") Data from NASA Black Marble (https://blackmarble.gsfc.nasa.gov/)
Data from NASA Black Marble (https://blackmarble.gsfc.nasa.gov/)
Tracking economic developments can be challenging when data are aggregated and released with a lag. In Algeria, for instance, GDP data are available up to the fourth quarter of 2022. To complement them, we show that public and timely satellite imagery capturing night-time lights (NTL) is a good proxy for economic activity. NTL from oil and gas extraction and processing areas indeed reliably estimate hydrocarbon sector GDP, while the statistical relationship between NTL that exclude these areas and nonhydrocarbon GDP is even stronger. Using these, we can produce GDP proxies with a one-month delay and uncover regional growth dynamics.
| Night-time lights data can be used to track Algeria’s economic activity, provided hydrocarbon and nonhydrocarbon activity are separated. Over the last decade, numerous studies have shown NTL to be a reliable indicator of economic activity. It is available with minimal delay daily, with high spatial granularity, and freely accessible on the Earth Observation Group and NASA website, and the World Bank has created a tutorial to help researchers utilize it independently (see link here). Recently, Roberts et al. (2020) used NTL to track the impact of the COVID-19 crisis in 47 cities of the MENA region, including Algiers, Oran, and Constantine. While NTL data can be used to provide a timely and spatially disaggregated indicator of economic activity in Algeria, the size of the country’s hydrocarbon sector poses additional challenges. The extraction and processing of oil and natural gas leads to significant amounts of light, which is noticeable around the Hassi Messaoud oil field (Ouargla wilaya), the Hassi R’mel gas field (Laghouat, Ghardaïa), as well as in the oil and gas producing wilayas (provinces) of Adrar and Illizi (Figure 1). Therefore, hydrocarbon and non-hydrocarbon activity should be analyzed separately. | Algeria’s oil and gas fields emit significant night-time lights. 
|
The correlation between hydrocarbon GDP and NTL originating from oil and gas production and processing sites is remarkable. We isolate NTL associated with gas flaring using the geo-coordinates of flaring sites provided by the World Bank’s Global Gas Flaring Reduction Initiative. In a simple econometric model, monthly “flaring lights” explain 94 percent of monthly crude oil production levels. Similarly, “non-flaring lights” in gas-producing wilayas explain 69 percent of monthly natural gas production levels, with a statistically significant coefficient on NTL from the Hassi R’mel gas field. By adding flaring lights from the oil refining and gas liquefaction plants in Arzew and Skikda, NTL explains 80 percent of quarterly real hydrocarbon value-added (Figure 2).
NTL is an equally robust indicator of Algeria’s nonhydrocarbon activity. We model real nonhydrocarbon GDP using non-flaring lights in Algeria’s four largest regions (North-West, North-Center, North-East, and Eastern Highlands), representing approximately 80 percent of the country’s population. In a univariate regression, NTL explains 87 percent of the level of real nonhydrocarbon GDP, which increases to 93 percent when accounting for the trend and seasonality in the data. We estimate that a 1 percent increase in NTL is associated with a 0.5 percent increase in nonhydrocarbon GDP (Figure 3).
Figure 2: NTLs from hydrocarbon-producing areas reliably proxy Algeria’s hydrocarbon GDP.  |
Figure 3: Non-hydrocarbon NTLs effectively proxy Algeria’s nonhydrocarbon GDP.  |
Source: World Bank staff estimates based on NASA and ONS data.
As a result, NTL closely proxies economic activity in Algeria and can provide insights into regional growth patterns. Our NTL predictor accurately estimated the average growth rate of nonhydrocarbon and hydrocarbon GDP from 2013 to 2016, as well as the magnitude of the slowdown from 2017 to 2019. The Eastern Highlands and Northwest regions were key drivers of nonhydrocarbon growth earlier but experienced a more significant slowdown before the COVID-19 crisis. Conversely, the Northcenter region, where Algiers is located, supported growth from 2017 to 2019. The sharp COVID-19 economic contraction affected all regions in 2020, but the Northeast region experienced a particularly steep decline. Lastly, the Eastern Highlands region showed a faster recovery in economic activity (Figure 4).
The model's reliability allows us to provide a proxy for GDP growth over the first three quarters of 2023. Timely estimates of economic activity are critical for policymakers, entrepreneurs, and investors and, while national accounts data from the National Statistics Office is available up to Q4-2022, our NTL-based proxies are available with a mere one-month lag. The latter indicates that solid nonhydrocarbon growth in 2022 continued during the first nine months of 2023, suggesting growth of 4.5 percent year-on-year. Factoring in the stability of hydrocarbon output, GDP growth would have accelerated to about 3.6 percent over the first nine months of 2023. This would be faster than during the pre-COVID years and reminiscent of Algeria’s pre-2015 growth performance. Meanwhile, the apparent deceleration in 2023 would have been driven by the North-Center region, notably the Algiers wilaya (Figure 5).
Figure 4: Algeria’s COVID-19 recovery appears cross-regional. 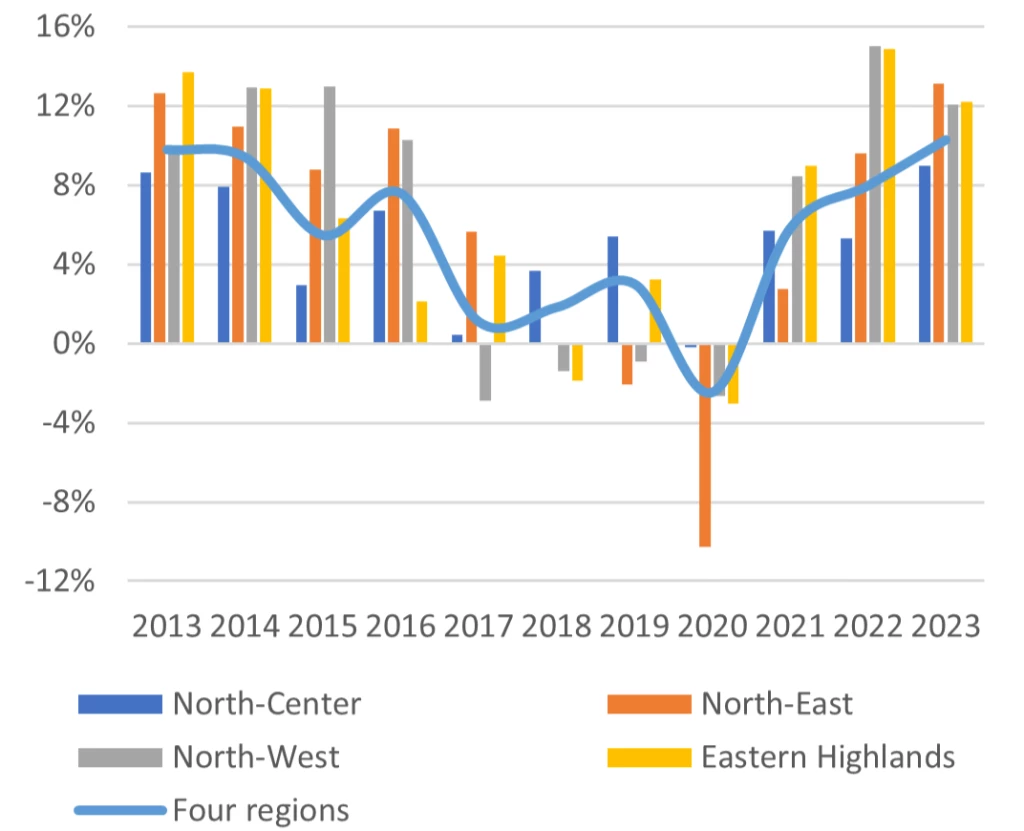 |
Figure 5: The observed slowdown in 2023 appears driven by that of Algiers. 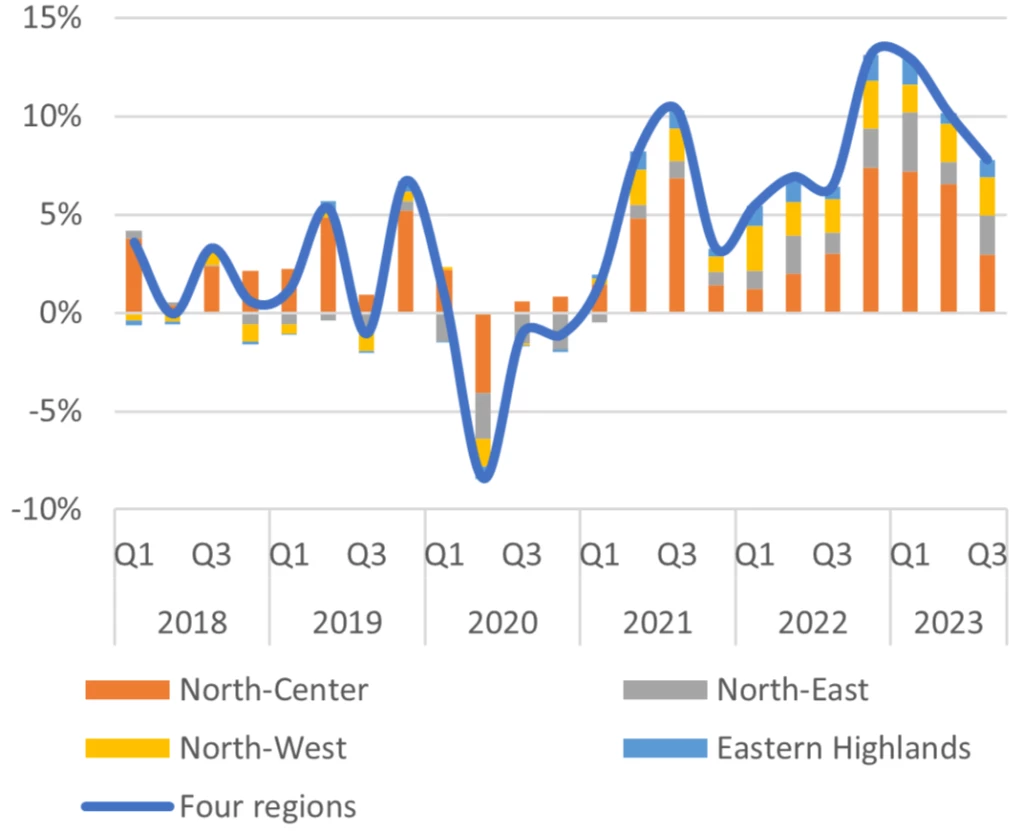 |
Source: World Bank staff estimates based on NASA and ONS data. Note: Year-on-year variations in NTLs. In figure 4, 2023 data refers to data for the first nine months.
In light of its value-added, NTL analysis is now an integral part of the World Bank’s semi-annual Algeria Economic Update (see latest here). It is part of an increasing set of unconventional and big data sources used to complement standard domestic and international ones to get a better and more timely pulse on the Algerian economy and its citizens’ welfare.


Join the Conversation