 An aerial view of West Bay, Doha City, Qatar, appears at sunset.
COVID-19 has hit cities hard. Overnight, stay-at-home orders and other restrictions have transformed vibrant hubs into shadows of their former selves. While these “non-pharmaceutical interventions” (NPIs) have curbed the disease’s spread, they have also sparked deep recessions in many cities. However, not all cities have suffered equally.
In the US, Chetty et al. (2020) show that, while consumer spending in Baltimore and San Francisco fell sharply between mid-March and mid-April, by mid-July in Baltimore it was nearly 2% up compared to January while in San Francisco, it remained more than 23% down. The authors’ Opportunity Insights Economic Tracker tracks which cities, counties, and neighborhoods are struggling most to recover.
Such “near real-time” monitoring is crucial to assess the scale of losses and understand how NPIs impact urban economies. It can also improve the design of policies to respond to the crisis.
Why night-time lights data?
Replicating Chetty et al.’s work for developing country cities is constrained by the availability of timely, high-frequency data. One approach we have been experimenting with, though, is high-resolution, night-time lights data, which is captured daily by satellite. The ability of lights data to track changes in economic activity was first brought to widespread attention by Henderson, Storeygard and Weil (2012). Since then, night-time lights have become widely accepted proxies of economic activity.
For a sample of 50 cities spanning 18 countries across the Middle East and North Africa (MENA), we used monthly composites of cloud-free satellite images and calculated changes in night-time lights as a proxy for changes in economic activity. To assess the role of lockdowns and other NPIs in these changes, we constructed daily “stringency scores” based on Oxford University’s COVID-19 Government Response Tracker for each city.
All cities experienced large declines in lights, but the pace of recovery is uneven
So, what does the monthly lights data show? Prior to the COVID-19 crisis, cities were, on average, close to their long-run growth trends, as estimated using monthly lights data going back to April 2012.
Figure 1 shows that the average MENA city suffered a massive fall in the intensity of lights in March, coinciding with the introduction of strict lockdowns and other NPIs. Correcting for “normal” monthly variation for each city, the median city’s lights were about 12 percentage points less bright in March 2020 than in December 2019. As cities began to ease NPIs, the intensity of lights began to recover slightly in April, and more rapidly in May.
Figure 1. Median changes in light intensity from the December 2019 baseline for MENA cities

Note: Based on 47 cities (Yemen excluded). Graph shows monthly changes from the December 2019 baseline relative to each city’s estimated pre-COVID-19 trend.
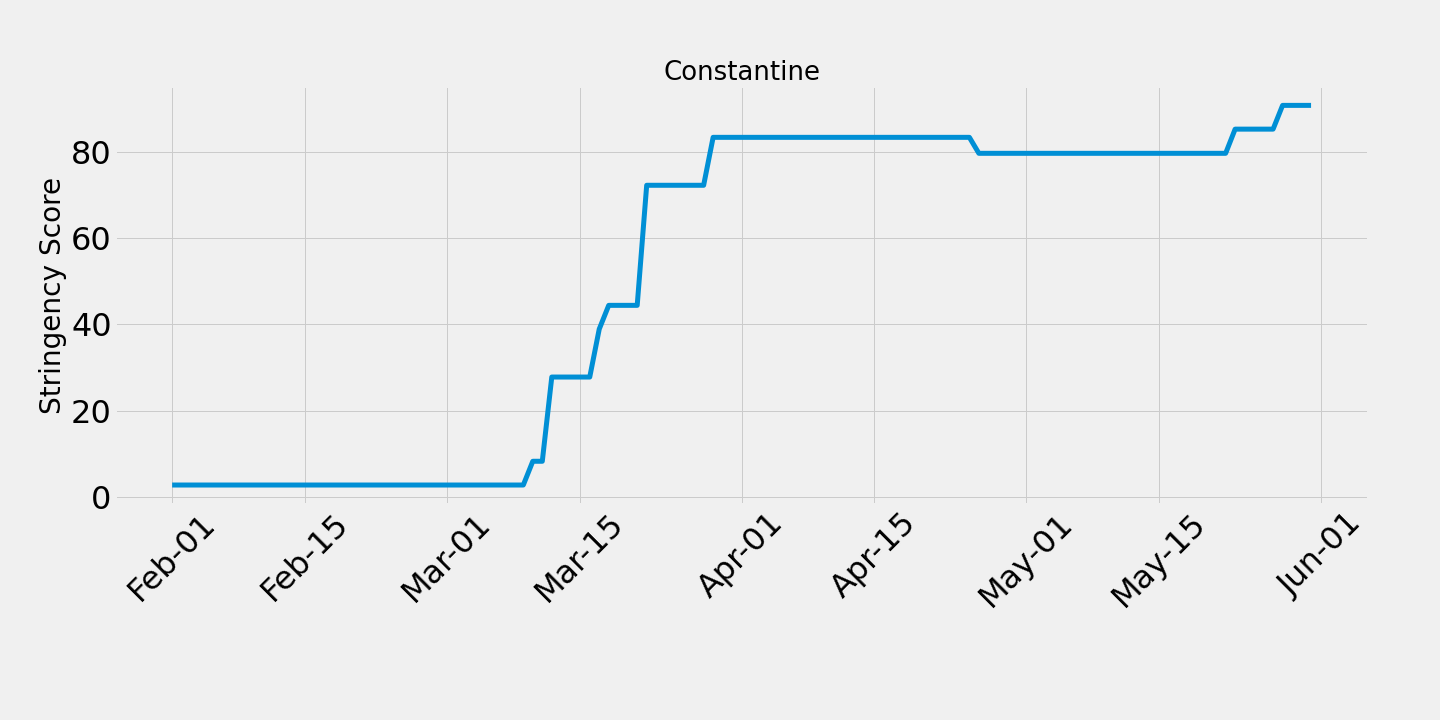
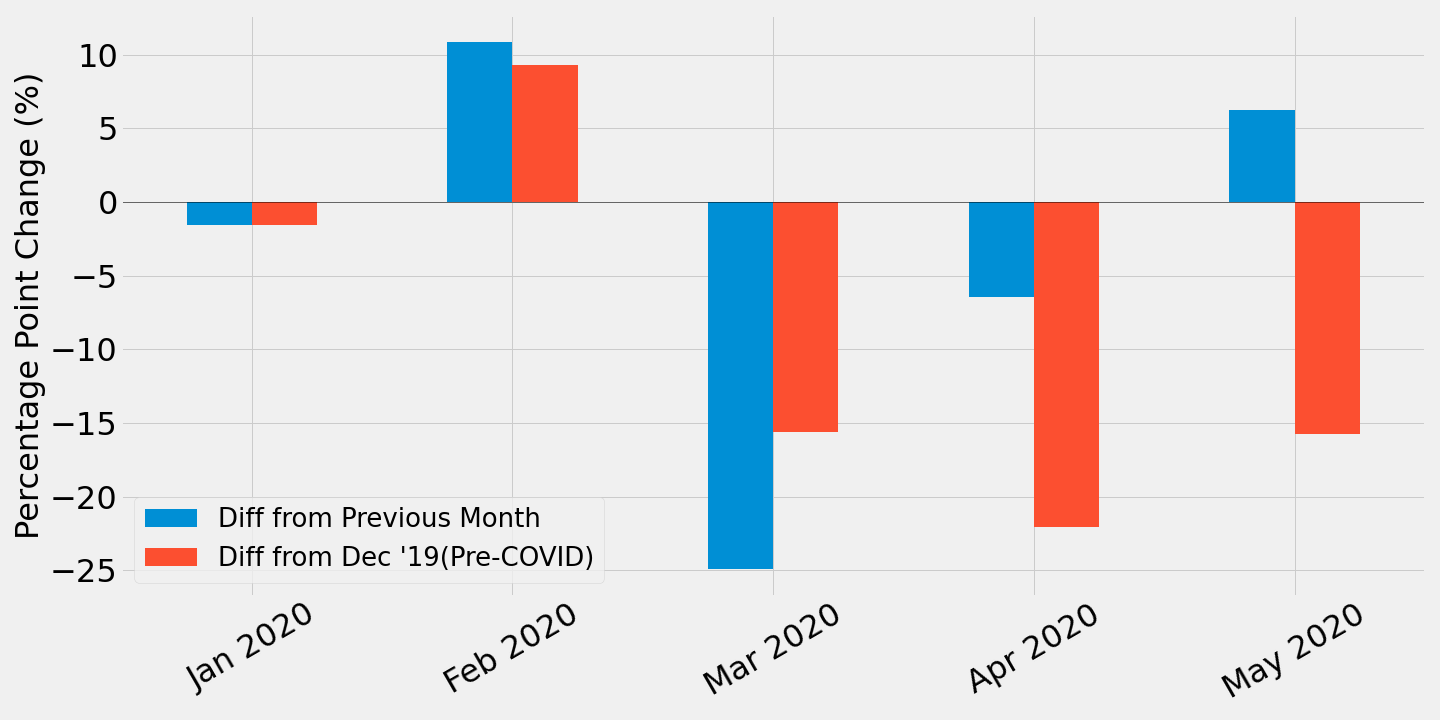
Constantine, Algeria, illustrates this average trajectory quite well.
As Figure 2 shows, after the intensity of lights increased in February, it suffered a sharp fall of 25 percentage points in March, as its stringency score spiked. April then saw a further, smaller, decline in the city’s brightness. There was some recovery in May, but the city’s lights remained about 15 percentage points less bright than in December after controlling for “normal” monthly variations.
Figure 2. The evolution of night-time lights and NPIs in Constantine, Algeria
| Stringency of non-pharmaceutical interventions |
Changes in night-time lights intensity relative to December 2019 baseline |
|
|
|
|
|
Change in night-time lights intensity, Dec. 2019 ® May 2020 Change in night-time lights intensity, Apr. 2020 ® May 2020


Note: Red areas denote losses in night-time light intensity; blue denote gains.
Not all MENA cities followed the same trajectory. While the large fall in light intensity in March was common, some cities—such as Sousse in Tunisia—subsequently re-gained their brightness faster, while others—such as Dubai in the UAE—struggled to recover. Variations in policy responses or pre-existing conditions, such as the city’s economic structure, could explain these differences.
Implications for policy
Our results suggest that night-time lights can track changes in economic activity across cities at a “near real-time” frequency. Our approach allows us to identify which cities have been economically hardest hit by the pandemic and, therefore, may need more policy support. Since the lights data is globally available at a fine spatial resolution, this approach is scalable to more cities within MENA and beyond. It can help inform policy and planning especially on wider issues of urban resilience, prompting debate on the investments cities need to enhance their ability to withstand future shocks.
What comes next?
Moving forward, we will explore the potential for fusing lights data with other high-frequency data, such as on nitrogen dioxide concentrations and traffic congestion. This may help us create an even better proxy measure of economic activity to track how well cities are recovering from COVID-19. We will also examine why some cities suffer more adversely from COVID-19 than others by, for example, exploiting data on the economic structure of cities.
The resulting insights will hopefully help us support cities in their efforts to rebuild faster and stronger from COVID-19.
The preparation of this blog benefitted from feedback from Somik Loll.


Join the Conversation