 Various bills from around the world. | © shutterstock.com
Policymakers in both developing and advanced economies agree that foreign direct investment (FDI) is a key element of a successful development strategy. The European Commission states: “FDI is a driver of competitiveness and economic development”. In the midst of the COVID-19 pandemic, the World Bank described FDI as key to crisis recovery. This sentiment is not new – an International Monetary Fund article from 1999 noted, “Recognizing that FDI can contribute to economic development, all governments want to attract it.”
The enthusiasm of policymakers is somewhat in contrast with the academic literature. While a few papers exist that find a positive link between FDI and economic growth, there is now a consensus that FDI flows alone are not enough and that complementary inputs such as human capital and financial depth play a central role in the link between FDI and economic growth.
New evidence on FDI and growth
In a recent paper, we reassess the literature on FDI and growth: we re-examine the relevant evidence by replicating the results from a set of influential papers, study how the link between FDI and GDP growth changes when we estimate those baseline models over different time periods and models, and introduce a new instrument aimed at assessing the causal effect of FDI on GDP growth. We found that the relationship between FDI and economic growth is far from stable. We also document that the mediating effect of human capital and financial depth, which had been established in the early literature on FDI and growth, no longer holds in the post-1990 period (figures 1A and 1B). Additionally, we found that ordinary least squares and instrumental variable estimates yield similar results—suggesting that our findings are unlikely to be driven by endogeneity.
Figure 1. Growth regression coefficients with 20-year rolling windows (1970–2018)

Note: Panels show coefficients from growth regressions, where the dependent variable is real GDP growth per capita (%) and FDI is FDI inflows relative to GDP (%), averaged over the 20-year range indicated. The country sample consists of a constant set of 81 emerging and developing economies. 95-percent confidence bands are shown. Schooling is the average years of secondary schooling and credit is private credit relative to GDP (%).
A possible explanation for our findings is “the second unbundling”: starting from the 1990s, better communication allowed firms to coordinate complex activities across borders. The global value chain (GVC) revolution then completely changed the nature of FDI and its potential effects on economic growth . For example, there are two opposing effects at play: On the one hand, GVCs reduce the “capabilities” that a country requires in order to receive FDI; on the other hand, GVCs allow multinational corporations to employ low-wage workers in poor countries while keeping the high value-added components of the production process in countries with higher skill levels.
Countries with lower levels of human capital may be attractive for foreign investments depending on the type of activity the FDI will generate (what types of skills are required) . As a result, the rise of GVC activity has enabled developing economies to grow, through the direct activities of foreign firms in host economies and through spillovers to the domestic economy. Recent work has found that GVC activity and FDI are tightly linked. Based on a simple assessment, we found that GVC activity in the manufacturing and services sectors, combined with “weak” absorptive capacities, have supported a stronger relationship between FDI and economic growth since the 1990s (figures 2A and 2B).
Figure 2. Effects of FDI on growth, conditional on absorptive capacity and GVC activity (1990-2009)
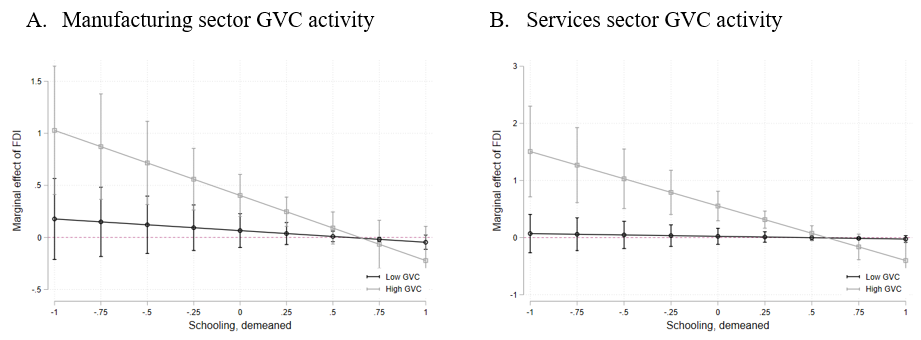
Note: Panels shows the marginal effects of FDI, where the dependent variable is real GDP growth per capita (%) and FDI is FDI inflows relative to GDP (%), averaged over 1990-2009. FDI is included alone, interacted with schooling and interacted with (Schooling x GVC indicator). The GVC indicator indicates when GVC growth is above (“High”') or below (“Low”') the sample median, separately for manufacturing or services GVC activity. The sample consists of a constant set of 81 emerging and developing economies. 85-percent confidence bands are shown.
Implications
The results in our paper suggest that FDI has a positive association with growth in countries that experience high GVC activity growth and have initial low levels of human capital or financial development . While this result suggests that countries with weak absorptive capacities do benefit from FDI, it also indicates that the FDI’s positive effect is driven by the low-value added components of GVCs. Strengthening human capital and improving financial development may be key to attract and benefit from high-value added components of GVCs and associated FDI. Further research in this area would better inform policymakers of these issues, particularly against the backdrop of potential FDI fragmentation and the post-COVID period.


Join the Conversation