Also available in: Español | Français

Electricity is integral to people’s well-being across the world. With electricity, children can study at night, women can walk home more safely on well-lit streets, and businesses can stay open well past dusk.
However, more than one billion people still lack access to electricity today. Governments and electric utilities around the world are mobilizing vast sums of money to close the access gap, especially in rural areas that are home to those lacking electricity.
So, how can we determine and identify who has electricity and who doesn’t? What if we had the technology and tools to help us see lights from space every night, for every village, in every country? We could then closely monitor progress on the ground. We could even plan and optimize policies and interventions in a different manner.
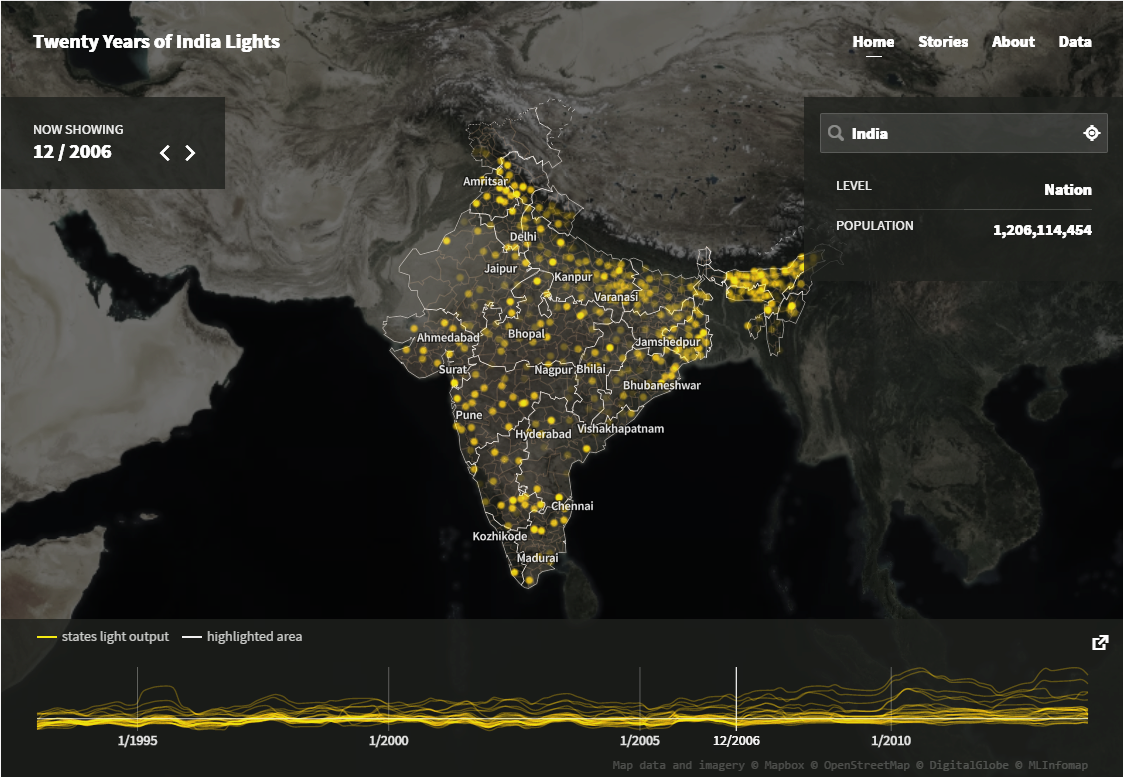
That “what-if” scenario is now a reality. Our latest initiative, NightLights.io, monitors four billion light signals on earth each day, and visualizes night light data spanning the last 20 years. Nightlights.io was made possible by space agencies around the world. Combined, these agencies have around 1,300 satellites currently in orbit and capturing a wealth of data and information on our planet.
We began to explore the use of night light data to monitor rural electrification in countries with low electrification rates, such as Mali and Senegal, and then expanded our work to Vietnam, which has a 98% electrification rate. Last year, through the World Bank’s Innovation Labs and Development Seed, we refined our approach and scaled up to look at the entire India, a country with a high density of villages. We analyzed the daily light signatures of more than 600,000 villages during a 20-year period (from 1993 to 2013), and visualized electrification trends on NightLights.io.
“This visualization will be a powerful tool to supplement the Indian government’s efforts to ensure rapid electrification,” said Onno Ruhl, the World Bank’s Country Director for India.
NightLights.io is an open source platform comprised of a pipeline to process massive amounts of data; an application programming interface (API) that enables technical partners to query light output; and a dashboard map to allow users to explore light output trends. This platform provides the ability to get high-level overviews, compare villages, plot trends, and share data. In addition, this platform is designed to be freely explored by users from any part of the world.
Night light data measured by satellite has been a useful resource for the development community for several years. Unfortunately the complexity of accessing, processing and manipulating this data has been a barrier to widespread use and scalability. Five years ago, a team from the University of Michigan, the U.S. National Oceanic and Atmospheric Administration (NOAA), and the World Bank Group’s Energy and Extractives Global Practice began to explore night light data in a scalable, systematic way.
We’re now looking ahead and making decisions on where to focus our next electrification efforts. Where has electrification been successful? What other variables are related to faster electrification? What other sources can we combine with these results to learn more? Could we mash up this dashboard with other development indicators? These are all questions we’ll begin to explore and hopefully answer in the coming months and years.
Today we are launching this platform at the World Economic Forum in Davos, Switzerland. Government officials, the private sector, and many interested parties are gathered and invited to provide feedback. We would like to refine the platform, build new capabilities, and generate nuanced reports to meet the myriad needs of potential country-level beneficiaries. We also want to see how this approach could be replicated across the developing world.
If you are interested in providing feedback, please write to Kiwako Sakamoto, and reach out to @brunosan if you are also in Davos.


Join the Conversation