Increasing evidence suggests that, to improve accountability and promote evidence-based decision making, open access to data and data literacy skills are essential. While in-person educational opportunities can be limited in parts of the developing world, free educational tools are available online to boost data literacy skills .
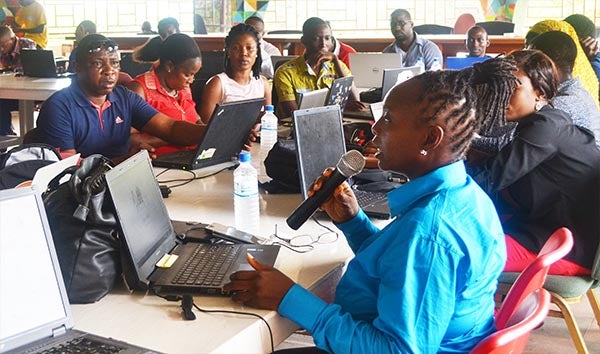
In June 2016, Code for Africa, with support from the World Bank’s Open Government Global Solutions Group, held a Data Literacy Bootcamp in Freetown, Sierra Leone, for 55 participants, including journalists, civil society members, and private and public sector representatives. One of the Bootcamp’s primary objectives was to build data literacy skills to nurture the homegrown development of information and communication technologies (ICT) solutions to development problems.
Here are five tools Bootcamp participants employed to help capture, manipulate, and visualize data :
- Tabula: Converts PDFs into excel and Comma Separated Values (CSV) files. Upload a PDF file, select the table of interest, preview the extracted data, and then export the excel spreadsheet.
- import.io – Extracts data from websites. Plug in an URL and the site’s algorithm extracts the data and presents it in CSV format.
- OpenRefine: Explores, cleans, and reformats data. The tool transforms your database’s cells in bulk to spot errors, edit data, and specify patterns.
- DataWrapper – Visualizes data. Copy and paste your data onto the site, select the type of visualization you want—charts, tables, maps—and you have interactive visualizations ready to be downloaded and used.
- Infogr.am – creates infographics and interactive charts to tell a story with data. Choose from over 35 chart types using pre-designed themes and then import your data from over 10 sources to create data visualizations.
In addition to Sierra Leone, these tools are particularly useful in challenging countries in which data is hard to come by and understanding of data is still incipient.
While open data is data that can be freely used, modified and shared by all, government data is not always available in a machine-readable format . This makes readable data hard to come by and prevents further analysis. Two tools, Tabula and import.io, address the challenge of scraping and extracting data by organizing files, whether in PDF or URL formats, into CSV files to make the data machine-readable.
Further interruption results in the form of data quality assurance. Data can be messy, requiring cleaning, reformatting, and/or transforming. OpenRefine is a critical addition to the data toolbox because it helps streamline the clean-up process to ensure authenticity of the data being used or accessed.
Despite extraction and quality assurance, sometimes the data is still too complicated to interpret. The ability to visualize data and turn it into meaningful and understandable information is valuable. DataWrapper and Infrogr.am resolve this issue by turning data into visual experiences making the data understandable and digestible to the public.
While some of the recommended tools listed are from paid subscription sites, each tool offers a free subscription plan (albeit, sometimes with limited features).
However, we know there are many other tools available on the web today. What tools would you add to this list to boost data literacy? Let us know in the comments!
Tweet these:
Here are five tools to help capture, manipulate, and visualize data
Open access to data and data literacy skills are essential.
What tools would you add to this list to boost data literacy?


Join the Conversation