Imagine the following scenario: you have a population consisting of two groups, who are, on average, equally poor at baseline. You randomly pick one group to receive sizeable cash transfers: what would happen to inequality within this population? It should increase, mainly because you increased between-group inequality, which was negligible at the start (assume away, if you wish, within-group inequality for now). At the same time, poverty should decline in the recipient group relative to the other group.
Now, what if I told you that there was such a cash transfer program and six months after the monthly transfers started being disbursed to the recipients, overall inequality in the entire population (i.e. treatment and control combined) declined substantially. Not only that, but inequality within each group declined, while poverty fell by approximately 50% after one year (again, overall and within each group).
How does such a thing happen? One obvious answer is spillovers: if the cash transfer program also affects the control group, then it becomes possible to have outcomes that are divergent from what would be expected under an assumption of ‘no interference.’ In a recent working paper, co-authored with Çiğdem Çelik, Scott Cunningham, P. Facundo Cuevas, and Luca Parisotto (author order random), evaluating the impact of the Emergency Social Safety Net (ESSN) in Turkey, the largest cash transfer program for international refugees in the world, we tell the story of how program benefits were spread out throughout the refugee population – beneficiary or not. It happened via substantial changes in household size and composition, with a net movement of primarily school-aged children from larger non-beneficiary households to smaller beneficiary ones
Children on the move…
There is strong prima facie evidence in our data that the program caused movement of household members, children in particular, between households. Table 4 in the paper shows that a gap of 0.66 had opened up between the treatment and the control group in household size after just six months, which was equal for both groups at six members per household at baseline. This gap slowly increased to 0.8 persons by the 18-month follow-up. The number of children (aged 0-17) increased by 0.33 in the treatment group and declined by an almost identical 0.32 in the control group.
There are two interesting aspects of this movement to note. First, the movement that caused a net increase (decrease) in household size in the treatment (control) group was part of a broader churn in household composition among the population of international refugees in Turkey: while more than 50% of households in both the treatment and control groups have no change in their household size at the six-month follow-up, many have lost or gained at least one member, with a non-negligible share of households losing or gaining two or more members (see Appendix Figure 3 in the paper). This implies that the movement was not only from control to treatment, but also from treatment to treatment, and control to control as well (and perhaps even treatment to control). Appendix Table 6 also makes it clear that vulnerable households are net senders of children regardless of beneficiary status, while better-off ones are net receivers.
Second, what rather defined the movement was baseline characteristics: households that lost at least one child by the six-month follow-up have a significantly higher number of children at baseline than the average household, lower per capita consumption, and a lower share of children enrolled in school. They are also more likely to be female-headed and resort to livelihoods-based coping strategies. In contrast, households that gained at least one child are much smaller, have higher consumption per capita, and a higher share of children in school.
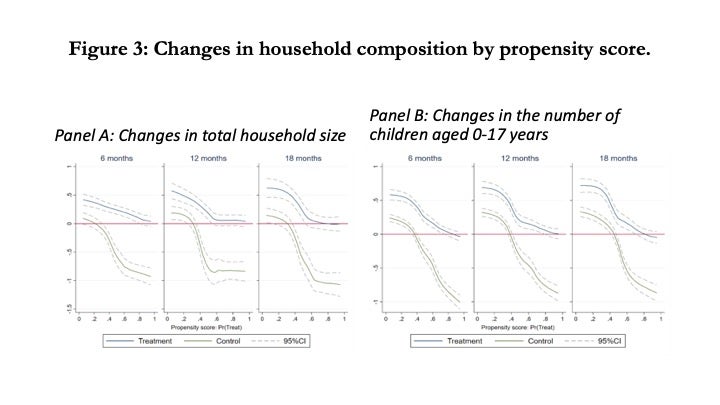
Figure 3 below summarizes the heterogeneity in changes in household composition by the baseline propensity to be eligible for the program. There is very little change in household size in the control group when the propensity score is low, but this declines rapidly, reaching almost one less person among the most vulnerable ineligible households. In contrast, the least vulnerable households in the treatment group see a large increase in size, but this impact declines and become zero among eligible households with high propensity scores. In Panel B, we see that the heterogeneity in household size is driven primarily by children
Why send children one way, instead of money the other way?
Rearrangement of household composition can be expected in response to safety net eligibility: in a paper similar to ours, Edmonds, Mammen, and Miller (2005) find that when elderly black women became eligible for old age pensions in South Africa, the number of children aged 0-5 and women aged 18-23 increased in their households, while that of women aged 30-39 declined. They argue that the rearrangement of household composition can be due to preferences, to enforce intra-family or -network informal contracts, or related to production.
In our study, the rearrangement of households involves primarily the movement of school-aged children (aged 6-17). We do not see a difference between the movement of boys and girls, nor are children more likely to move into households with an elderly member present. Hence, we find it unlikely that the changes in household composition among refugee households in Turkey were due to preferences or production. It is more likely that some control households responded to the revelation of their initial eligibility status by sending children into environments where they will have more access to resources and to school. Child fostering, the practice of sending children to live with relatives, can be a mechanism through which families respond to income shocks (Akresh 2009 and Penglase 2020, among others), although it is not known to be commonly practiced in Syria – the source of more than 90% of the international refugees in Turkey.
The movement of children between households that we observe seems to be brought on by necessity: vulnerable refugee households in a new country responding to their difficult circumstances and the revelation of their initial beneficiary status. Our finding that children are more likely to move away from female-headed households with a large number of (out-of-school) children and low per capita consumption, and be received by better-off households is consistent with the findings of Akresh (2009), who finds that households in Burkina Faso with negative income shocks with more “good” quality network members are more likely to send a child.
Well, but if you have all this interference in your study, what kind of impacts can you estimate?
Hence, our data strongly suggest a violation of the stable unit treatment value assumption (SUTVA). As a result, without further structure on the nature of the interference between beneficiary and non-beneficiary households, we cannot identify the usual ‘intent-to-treat’ or ‘average treatment’ effects. What we can identify is what biostatisticians, public health experts, or communicable disease specialists sometimes call the ‘direct effect’ of the program (see Özler 2016): a comparison of beneficiaries and non-beneficiaries living in close proximity (or in the same network).
Baird et al. (2018), in the context of cluster-RCTs, call this estimand the ‘value of treatment,’ or VT, because it is “…the individual value of receiving treatment in the treated cluster.” For example, the value of getting vaccinated against a disease could be very small for an individual if everyone else in her community is already vaccinated – due to herd immunity. The intuition here is that, unless spillover effects are zero, then the ITT will not be equal to the VT (VT = ITT - spillover effects). Hence, we can estimate ‘value of treatment’ estimates, which is the ‘value of being an ESSN beneficiary’ for an applicant household (that lives among and interacts with other beneficiary and non-beneficiary households). This implies that if the ‘value of treatment’ is zero for an outcome of interest, it does not necessarily mean that the ESSN was ineffective in improving that outcome. This depends on the size of the spillover effects on non-beneficiary households.

What impacts do we find?
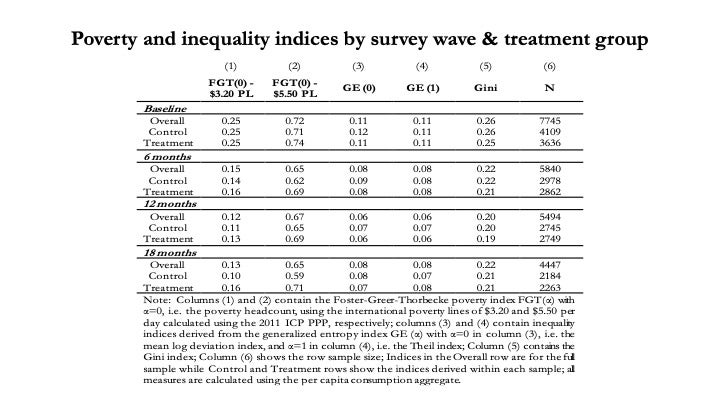
We mentioned the changes in poverty and inequality for the entire study sample, which are shown below (Table 7 in the paper). Poverty at the international poverty line of $3.20 per person per day declined from 25% to 13% after 18 months – an almost 50% decline in consumption poverty. The Gini coefficient of inequality declined from 0.26 to 0.22 among the refugee population – a very large decrease within a short span when it comes to the Gini index. It’s important to note that these are just time trends from baseline to three follow-ups and not value of treatment effects.
Despite the fact that our study is not a randomized controlled trial, we did register a pre-analysis plan with EGAP that specified the following primary outcomes before accessing the follow-up data: consumption per capita, three indices of coping strategies, and enrollment among school-aged children. We start with coping strategies first, followed by schooling, and discuss the VT effects on total and per-capita consumption last.
The Food Consumption Score (FCS) is an index of the diversity and frequency of foods consumed at the household level, calculated using the frequency of different food groups consumed by a household during the past seven days. ESSN had a positive effect on the FCS score – primarily due to substantial increases in the frequency of consuming fruits and vegetables, as well as foods containing animal-based proteins. As the FCS scores at baseline were mostly at acceptable levels (24% had borderline scores and only 3% unacceptable) and with positive time trends, these are encouraging findings.
Two other indices for coping strategies, reduced consumption and livelihoods, show similar effects: the VT effects were positive and significant at the start of the program, but dissipating over the 18-month study period. However, strong positive time trends in the control group suggest that all refugees (treatment and control) were coping better at the 18-month follow-up than baseline. Finally, although there was no statistically significant effect on overall school enrollment, there were meaningful gains among children living in the most vulnerable beneficiary households (Figure 4).
Total household expenditures are approximately TRY80-100 higher among ESSN beneficiaries at the 6- and 12-month follow-ups, but smaller and statistically non-significant at the 18-month follow-up. The effects, at about PPP$35-$49, represent 5%-7% of total household expenditures in the control group, or a modest effect size of 0.15-0.20 SD during ESSN’s first year. The increase in consumption primarily comes from increased food and education expenditures. We also note that, while remittances sent are very low in both groups, treatment households spent more every month making debt repayments over all follow-up rounds, causing the stock of debt among them to be 18%-24% lower than the control group.
We find that the VT on per capita consumption is negative and significant in every round: per capita expenditure levels in beneficiary households are about 6%-10% lower than those in non-beneficiary households, an effect size that translates to 0.14-0.26 SD depending on which follow-up round. Given that the effects on total consumption are positive, the negative per capita result is clearly a function of the almost 0.8-person gap in household size that opened up between the treatment and control groups in the 18 months following baseline data collection. As with the FCS and coping strategies indices discussed above, there is a consistent positive time trend in real total consumption in the control group, which had increased by almost 10% by the 18-month follow-up.
Study limitations…
We devoted a long and detailed section (Section 4) to the discussion of identification strategy and threats to identification. To summarize them here, we faced four important issues:
· First, the program was not randomly assigned. We conducted a matching exercise to use inverse propensity weights (IPW) to create a credible counterfactual. The baseline characteristics of the two groups are significantly different before the IPW but balanced afterwards. Since causal identification of program effects hinges on conditional independence, it is useful to consider how similar households ended up with different beneficiary status at baseline. Section 4.1 of the paper discusses this issue in detail, but households that appear de facto eligible at baseline could be deemed de jure ineligible by the program administration and vice versa - due to the absence of documentation, spelling differences in existing documents, a backlog of cases to be processed, or difficulties in linking registrations of household members. Our identification strategy allows us to exploit such discrepancies between a household’s demographic characteristics at baseline and what was registered in the underlying databases, and match households that appear very similar on observables but have discordant treatment status.
· Second, as there is high attrition in the phone surveys that were used at each follow-up, in each table showing program impacts, we present upper and lower bounds on impact estimates for all primary outcomes (Lee 2009), as well as bounds using the techniques of Kling and Liebman (2004).
· Third, we already discussed the SUTVA violation, which causes us to estimate VT, rather than ITT, effects.
· Finally, eligibility status of households in the originally sampled treatment and control groups changed over the 18-month study period: households could become eligible (e.g. by registering a newborn) or ineligible (e.g. due to expiration of a disability report) for cash transfers. This is not a threat to the identification, but affects the interpretation of impacts over time, as the gap in the share of treatment and control receiving cash transfers declines over time from 100% at baseline to 72% at the 6-month follow-up to just 34% at the 18-month follow-up.
Conclusion
After addressing all these challenges to identification, a robust picture emerges nonetheless. The VT effects are generally positive for total consumption, FCS, and the coping indices. The treatment group is less indebted. And, school enrollment has increased among the most vulnerable households at baseline. Combined with the likely positive spillover effects through rearrangement of household composition and the positive time trends, these improvements represent good news for the study population over the course of the 18-month study period.
However, it is also possible that a significant amount of this churn in household composition could have been avoided. If a sufficiently small share of refugees is treated within a given network (be it geographic or kin), the pressure for the beneficiaries to share the transfers with others can be high – resulting in smaller than expected treatment effects (Jakiela and Ozier 2016). The first-best policy response to these findings may well be that programs designed to assist refugees should receive more generous funding so that they can increase the share receiving assistance. Donors could consider universal child support grants (and, perhaps, old age pensions) for refugee households, meaning that all refugee households would receive modest transfers to support children (and elderly), while cash transfers for able-bodied adults could then be targeted to the most vulnerable among refugee populations.
However, even when the available funding is fixed, the design of such programs could be potentially improved in a budget-neutral manner: the program could have treated a larger group of households but offered a smaller cash transfer per individual. Such a simple adjustment is likely to be beneficial, as it is unlikely that the separation of children from their immediate families is desirable. Overall, to strike the right balance between transfer size and coverage, key parameters in the design of any cash transfer program, policy makers should consider the possibility that refugee populations may respond to their eligibility status by altering their household structure and living arrangements.


Join the Conversation