The March 2021 global poverty update from the World Bank revises the previously published global and regional estimates from 1981 to 2017. In summary, the updated poverty estimates continue to show a decrease in global poverty up until 2017, and to 2018/2019 for some regions, which predates the reversal projected for 2020 as a result of COVID-19.
For the regions with sufficient population coverage, the 2018 estimates are updated and new poverty estimates for 2019 are added. The update includes new surveys that have been received and processed, as well as several changes to the existing data. Notably, this update includes for the first time poverty estimates based on imputed consumption data for three countries in Sub-Saharan Africa (Somalia, South Sudan, and Zimbabwe), including data on Somalia that previously had no survey estimate available in PovcalNet. This type of data is important to broaden the coverage of countries where full household surveys are less frequent, such as in fragile and conflict-affected countries. For this data release, we also conducted an extensive revision of historical datapoints (largely in the 1990s and early 2000s). Other changes reflect improvements in the welfare aggregate based on new harmonization efforts and more available information. This document outlines the changes made to the underlying data by country and explains why the changes have been made.
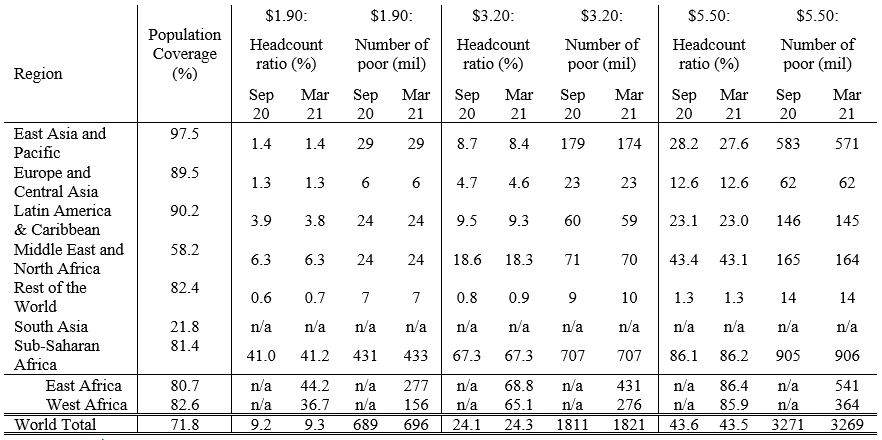
Table 1 shows the poverty estimates in 2017 for those regions that have sufficient population coverage and illustrates the impact of the data updates on global poverty for 2017, which remains the latest year with sufficient population coverage at the global level. We also include a split of Sub-Saharan Africa into East and West Africa, following the new regional classifications adopted by the World Bank. The estimates for 2017 were first published in September 2020, and this is the first revision. With the new data, the estimate of the global $1.90 headcount ratio increases very slightly, from 9.2% to 9.3%, and the number of poor increases from 689 million to 696 million people.
Table 1. Poverty estimates for 2017, changes between September 2020 and March 2021 vintage at different poverty lines
Source: PovcalNet
Note: Regional and global poverty estimates are reported if the available survey data account for at least 50% of the population within a three-year window of the reference year. In addition, the global estimate is only reported if at least 50% of the population in low- and lower-middle-income countries is covered (for 2017 this coverage is: 52.9%). (Details on population coverage rule are available here) The number of poor for Sub-Saharan Africa is equal to the sum of West and East Africa; any discrepancy is due to rounding. Replication code to obtain the East/West Africa estimates is available here.
The increase in the millions of poor at the global level is largely explained by an increase in South Asia by 5.5 million. South Asia is not shown separately in the table since it does not meet the population coverage criteria due to the absence of recent data for India. The global estimate, however, includes estimates for all countries, including South Asia. The increase in South Asia is mostly explained by new survey data for Pakistan in 2018/19, which leads to an upward revision of the previous poverty estimate that was based on an extrapolation of the 2015/16 survey.[1] Another reason for the upward revision is a change in the regional poverty estimate for Sub-Saharan Africa from 41.0% to 41.2%, which is largely explained by the availability of the first survey-based estimate for Somalia. This improves the precision of the reference year estimate; previously, Somalia was based on the regional poverty rate, which is PovcalNet’s imputation method for countries without household survey data.
This update also revises poverty estimates for 2018 for those regions with sufficient population coverage and adds estimates for 2019 wherever possible (see the figure below). These numbers confirm a downward trend in poverty rates in East Asia and the Pacific, reducing the poverty headcount ratio at the international poverty line from 2.1% in 2015 to 1.0 % in 2019, driven by decreases in poverty in China and the Philippines. In contrast, spurred by the conflicts in Yemen and Syria, the Middle East and North Africa region has seen a sharp reversal, with the poverty rate increasing from around 2.1% in 2013 to 4.3% in 2015 and 7% in 2018. In Latin America, poverty has largely stagnated, remaining at around 3.7% between 2015 and 2019. Estimates for Sub-Saharan Africa show that while the poverty rate continues to decrease, the number of poor increased by 18 million people between 2015 and 2018, continuing a trend documented in recent analysis. Most of the poor in Sub-Saharan Africa live in the East Africa region, which is home to 60% of the Sub-Saharan African population and almost two-thirds of the region’s poor. While the poverty rate is around 7 percentage points higher in East than in West Africa at the US$1.90 poverty line, differences become smaller at the higher lines of US$3.20 and US$5.50.
[1] A downward revision to national accounts data for India also contributes to the changes in South Asia (see here for more details). The estimate for India that is included in the global headcount is described in World Bank (2020) (Chapter 1, box 1.2) and Castaneda et al. (2020).


Join the Conversation