As economists and development practitioners increasingly use satellite data to guide and evaluate development interventions, we can sometimes neglect lessons learned from related disciplines. Data on human emissions of nighttime lights, as detected by satellites, are one such example.
A World Bank blog four years ago asked "what if we had the tools to see lights from space every night, for every village, in every country?" The happy news conveyed was that we had such a tool, and gave an interface for getting Defense Meteorological Satellite Program (DMSP) data on night lights for villages and districts in India. More generally, a recent review finds more than 150 papers in economics using night lights data, almost all of which use these DMSP data.
It is great that these data are being used in many creative ways. However, there is a significant risk of misinterpreting what satellite-detected night lights data can and cannot measure. A case in point is the common belief that DMSP data detect differences in light for areas as small as one square kilometer. This is incorrect, and holding this belief may lead to neglect of better sources of night lights data, such as the VIIRS Day-Night Band on the Suomi satellite. Illustrating flaws in DMSP data may help speed the transition to using better data and therefore speed progress in ending poverty and boosting shared prosperity.
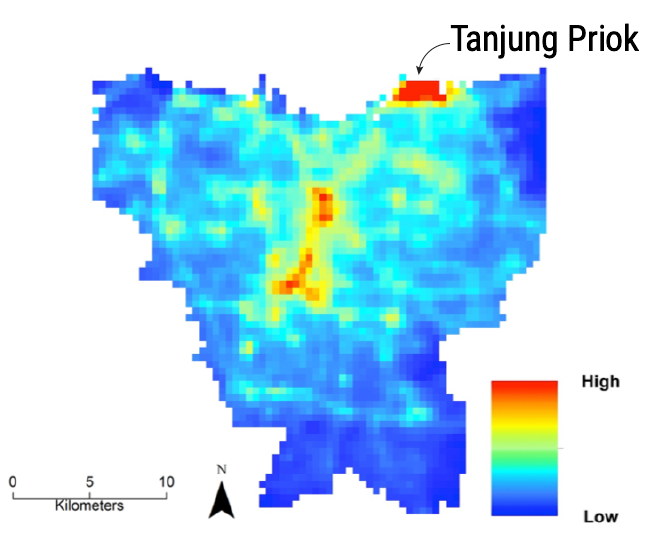
I provide examples from both ends of the economic density spectrum. The first is from Jakarta, and specifically the port of Tanjung Priok, pictured below. This is the 22nd busiest container port in the world, just ahead of the port of New York City/New Jersey. It handles about two-thirds of Indonesia's international goods trade. The port area exceeds 900 hectares and is very brightly lit (to give an idea of scale, 900 hectares is three times bigger than Central Park in Manhattan).

Tanjung Priok shows up very clearly in VIIRS Day-Night Band annual composites as the largest block of bright lights in Jakarta. The image below shows this, where pixels in the port area have radiance values of about 130 nW/cm2/sr. In contrast, six kilometers to the southeast, by Jakarta's boundary, radiance values are less than ten nW/cm2/sr. The variation in light intensity reflects the intra-urban heterogeneity in economic density and is typical of all cities.
Remarkably, the widely used DMSP data cannot distinguish the port from surrounding areas. In the usual DMSP data, for so-called 'stable lights' (which just means non-ephemeral), 82% of Jakarta gets the top-coded Digital Number (DN) of 63. Almost all of the rest get a DN value of 62. With such crude data, one simply cannot see the tremendous spatial variation within Jakarta.
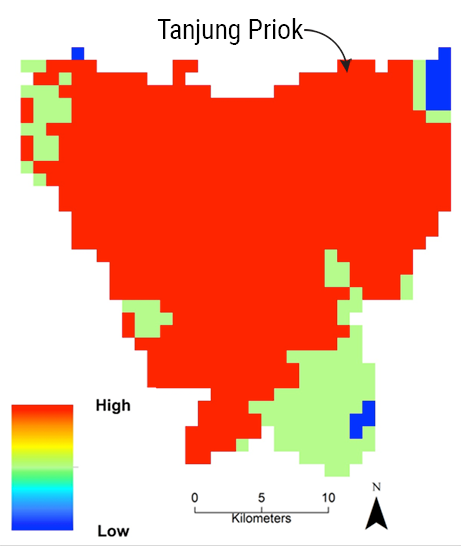
There are radiance-calibrated DMSP data, for seven years (versus 22 years for usual DMSP data), from experiments when the Air Force turned down sensor amplification on a few nights to avoid top-coding brightly lit urban areas. There are also Pareto-adjusted lights, where top-coded pixels have values changed to follow a Pareto distribution (a power-law often used for the upper tails of skewed distributions, such as for wealth). Neither approach distinguishes Tanjung Priok from the surrounding area. Thus, spatial inequality in the urban sector of Indonesia is greatly understated if DMSP lights data are used rather than using the more accurate VIIRS night lights data. The same is true for other cities.
At the other end of the economic density spectrum, DMSP lights data poorly measure rural areas. For example, Nordhaus and Chen gridded the globe into one-degree cells and found one-third of cells with positive population and output were recorded as having zero light in DMSP data. In a study covering all of Africa, almost half of the cells were recorded as having zero light with the DMSP data, yet all cells recorded light in the VIIRS data. Indeed, even for cells with a range of 10,000 to 100,000 people living in them, DMSP data record 51% of the cells as having no light output.
To understand why satellites miss rural, low density lights, it helps to know what type of light can be detected from space. To test spatial accuracy of DMSP sensors, researchers lit up dark corners of the wilderness in Colorado and New Mexico. For DMSP to detect these temporary lights, the researchers needed a bank of 1000-watt high pressure sodium lamps (large lamps of about 25 kg each, usually used in big warehouses) that look like this:

To further aid detection from space, the experiment was fielded in winter when nights were darkest, and the lights were modified with aluminum shields to help direct light skyward. Even with these steps that move well away from the type of lights found in villages, the DMSP satellites could detect the lights on only half the nights. Unfortunately, the light detecting technology for commonly used DMSP data is well short of the "every village in every country, every night" aspiration.
VIIRS has much better low-light detection capabilities, with a dynamic range of seven orders of magnitude versus only two for DMSP. Nevertheless, even with the more powerful VIIRS sensors, the relationship between rural economic activity and night lights is quite weak, as seen in South Asia, in Indonesia, and even in the United States. This likely reflects the fact that brightly-lit night-time activity is a feature of many aspects of urban life, but concentrated lights are less needed for agriculture and other rural activities.
Even using lights data just for cities, or at the national level, there are grounds for caution. The DMSP time-series is affected by unrecorded variation in sensor amplification—which occurs due to the original purpose of DMSP to observe cloud-tops in varying moonlit conditions—and by differences between satellites that are not calibrated. Hence, the annual composites of Digital Numbers for one satellite-year are not comparable to those from another satellite-year.
There is also misunderstanding of spatial precision, when using DMSP data to compare places. Resolution is distorted as the sensor scans further from center of its 3000km sweep of the Earth's surface. At the center of the sweep, the sensor captures lights from an area of about 7km2. This area gets 240% larger at the edge of the half-sweep (750km from center), the boundary that scientists set for usable images (images get ever more blurred going out towards the edge). All lights from this expanding area wrongly get attributed to a small pixel in the center and geolocation errors further displace the signal by about 3km from where light is emitted. If data scientists cannot pinpoint where lights are coming from, data are much less useful for development practitioners.
To overcome this distortion, an algorithm to deblur DMSP data was developed a few years ago (blogged here and published here) but is rarely used. A review of uses of DMSP data, mostly in developing country contexts, found just 1-in-10 recent studies used deblurred data, despite the algorithm being available since 2015. Yet many of these studies repeat the claim that the DMSP data detect differences in light for areas as small as one square kilometer.
One way to think about the spatial precision of satellite-detected night lights data is to follow remote sensing experts. These experts describe DMSP as capturing light from a 25km2 footprint at the center of the scan, which gets even bigger moving away from the center. In contrast, the VIIRS ground footprint is 45 times smaller at the center. Moreover, VIIRS keeps a constant resolution as it moves away from the center of its scan, so the margin by which the spatial precision of VIIRS exceeds that of DMSP gets even greater.
More generally, given that the DMSP time-series data ended in 2013, while VIIRS is available up to early 2020, now is the time to make the switch to the newer and better VIIRS data. It is more accurate and will lead us to better informed development solutions for the world's poorest.
Join the Conversation