Translations available in Chinese and Spanish.
Many of you are already familiar with the PPP (Public-Private Partnerships) Group’s Private Participation in Infrastructure (PPI) Database. As a reminder for those who aren’t, the PPI Database is a comprehensive resource of over 8,000 projects with private participation across 139 low- and middle-income economies from the period of 1990-2015, in the water, energy, transport and telecoms sectors.
We recently released the 2015 full year data showing that global private infrastructure investment remains steady when compared to the previous year (US$111.6 billion compared with US$111.7 the previous year), largely due to a couple of mega-deals in Turkey (including Istanbul’s $35.6 billion IGA Airport (which includes a $29.1 billion concession fee to the government). When compared to the previous five-year average, however, global private infrastructure investment in 2015 was 10 percent lower, mainly due to dwindling commitments in China, Brazil, and India. Brazil in particular saw only $4.5 billion in investments, sharply declining from $47.2 billion in 2014 and reversing a trend of growing investments over the last five years.
While commitments in Brazil, China and India slowed down, investments in other emerging economies surged to $99.9 billion , representing a 92 percent year-over-year increase. While again, much of this investment is in Turkey (with a record total investment of US$44.7 billion in 2015), eleven of these countries committed at least $1 billion in 2015. Furthermore, El Salvador, Georgia, Lithuania, Montenegro, Uganda, and Zambia were among those to reemerge from a hiatus to close at least one PPP project in 2015.
Project sizes are also becoming larger in the last four years, with the highest ever average size of $419.3 million in 2015, indicating an upswing in market confidence as sponsors and lenders finance larger projects in smaller economies. The top five countries with the highest investments in 2015, in descending order, were Turkey, Colombia, Peru, the Philippines, and Brazil, together garnering $74 billion or 66 percent of global commitments in the developing world.
Furthermore, renewables continues to tell a compelling story, with solar energy investments in 2015 climbing 72 percent higher than the last five-year average. In fact, two-thirds of all energy investments with private participation were in the renewables projects.
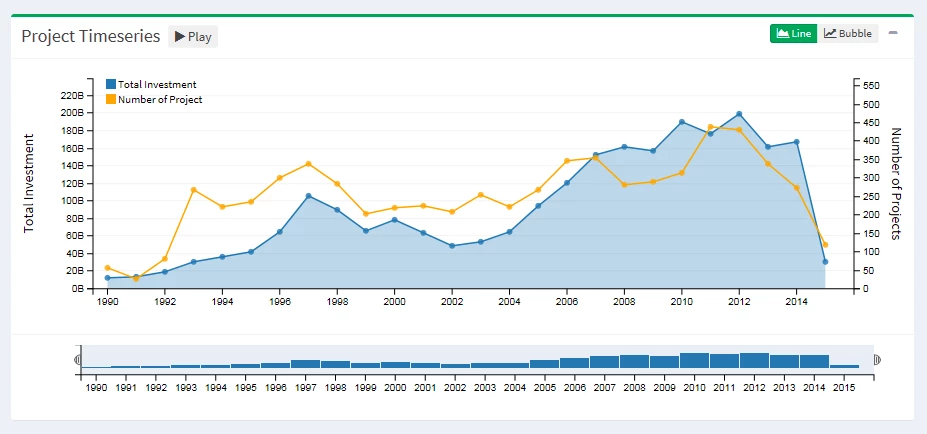
An exciting new addition to the PPI Database website is a data visualization tool – known as the PPI Dashboard – which allows users to filter the data by various categories, and then automatically generate a series of charts, graphs and maps that display the PPI in the categories chosen. For example, you could search by specific region, country, or sector, and the tool will display various graphs and visualizations for each cluster of data.
To enable the delivery of higher quality and more accurate data, we have introduced some improvements to the database, including revising the methodology to narrow down the number of variables and redefining certain terms, such as financial closure, along new market practice. We are also updating the publications section and welcome the opportunity to feature more publications from researchers who have used the PPI Database as a primary resource. The new data and the new data visualization tool are both available at http://ppi.worldbank.org/. Please plug in the comments section below links to publications or research you are aware of that uses the PPI Database. We welcome your feedback.


Join the Conversation