There has been a broad-based slowdown in productivity growth since the global financial crisis, affecting the majority of advanced economies and emerging market and developing economies (EMDEs). Productivity growth is the primary source of lasting income growth, which in turn is the main driver of poverty reduction. Whereas the one-quarter of emerging market and developing economies (EMDEs) with the fastest productivity growth have reduced their extreme poverty rates by an average of more than 1 percentage point per year since 1981, poverty rates rose in EMDEs with productivity growth in the lowest quartile. The broad-based slowdown in labor productivity growth over the past decade has raised concerns about progress in achieving development goals.
1. Broad-based slowdown in productivity
Note: Productivity is defined as output per worker. Unless otherwise indicated, data is from a sample of 29 advanced economies (AEs) and 74 emerging market and developing economies (EMDEs). Aggregates are GDP-weighted at constant 2010 prices and exchange rates.
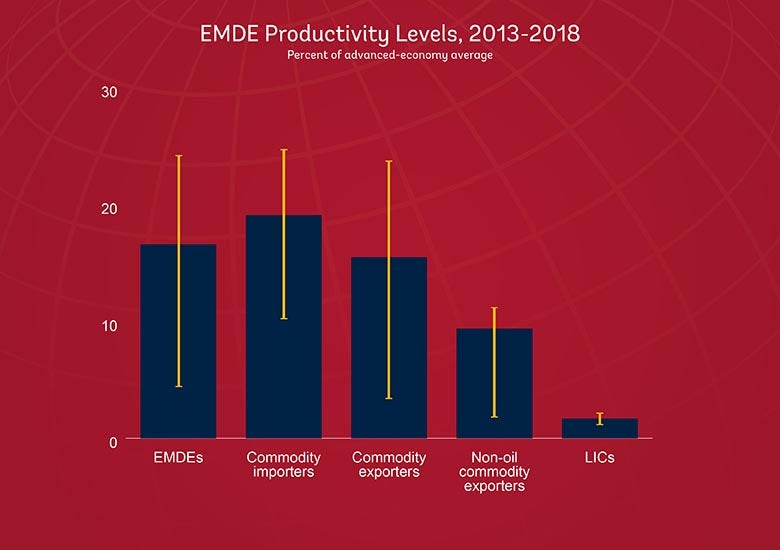
2. EMDE productivity levels remain substantially below those of advanced economies.
Average output per worker in EMDEs is less than one-fifth of that in the average advanced economy and just 2 percent in LICs.
Note: Productivity defined as output per worker in U.S. dollars (at 2010 prices and exchange rates). Based on 29 advanced economies and 74 EMDEs, which include 22 commodity-importing EMDEs and 52 commodity-exporting EMDEs.Blue bars indicate unweighted average output per worker during 2013-18 relative to the advanced-economy average. Whiskers indicate interquartile range relative to the advanced-economy average.
3. Sectoral reallocation is dwindling
The productivity slowdown has coincided with lower productivity gains from sectoral reallocation – the movement of workers and other resources to more productive sectors from less productive ones, such as a transition from subsistence agriculture to manufacturing.
Notes: Sample includes 80 economies, including 46 EMDEs (of which 8 are LICs), using data for 1995-2015. Growth “within sector” shows the contribution to aggregate productivity growth of each sector holding employment shares fixed. The ‘between sector’ effect shows the contribution arising from changes in sectoral employment shares.
4. Many underlying drivers of productivity are slowing
Many correlates of strong productivity growth have been slowing or stagnating.
Notes: Post-crisis slowdown defined as the share of economies where improvements in each underlying driver of productivity during 2008-2017 was less than zero or the pace of improvement during the pre-crisis period 1998-2007. Variables corresponding to each concept are (sample in parentheses): Investment (69)=investment to GDP ratio, Demography (74)=share of working-age population, Innovation (33)=patents per capita, Gender equality(32)= Share of female labor market participation rate to male, Urbanization (74)=Urban population (% total), Institutions (74)= WGI Rule of Law Index, Income equality (72)=(-1)*Gini coefficient, Education (72)=years of schooling, ECI (55) defined as Economic Complexity Index of Hidalgo and Hausmann (2009). Price stability excluded due to demand-side influences on inflation following the global financial crisis.
5. Policies can boost productivity
Notes: GDP-weighted average. EMDEs = emerging markets and developing economies. The reform scenario assumes: (1) Fill investment needs: the investment share of GDP increases by 4.5 percentage points as in the Rozenberg and Fay (2019) “preferred” infrastructure scenario. The increase is phased in linearly over 10 years (2) Boost human capital: average years of education increases in each EMDE at its fastest cumulative 10-year pace ending during 2000-08; (3) Reinvigorate technology adoption: economic complexity (Hidalgo & Hausmann 2009) increases at the same pace as its fastest 10-year rate of increase ending during 2000-08.
RELATED
Global Growth: Modest Pickup to 2.5% in 2020 amid Mounting Debt and Slowing Productivity Growth
The global economic growth outlook in five charts: Fragile, handle with care


Join the Conversation