 Taxes on sugar-sweetened beverages can help improve population health and bring in new revenue. Copyright: Vincent Tremeau/The World Bank.
Amid multiple crises and one of the sharpest global economic downturns in nearly three decades, policymakers are looking for new tools to improve productivity and raise revenue. Sugar-sweetened beverage (SSB) taxes are of increasing interest for their potential to both improve population health and bring in new revenue. These taxes increase the price of sugary drinks such as sodas and energy drinks, relative to healthier alternatives such as unsweetened water.
Consuming SSBs regularly has been linked to obesity, heart disease, diabetes, and tooth decay, among other harmful effects. In 2016, more than 2 billion people worldwide were overweight or obese, and over 70 percent live in low- or middle-income countries. These diseases have major impacts on economies by reducing productivity and life expectancy, and increasing disability and health care costs. New evidence from Mexico and the UK shows that SSB taxes lead to reduced obesity, particularly in teenage girls.
Globally, SSB taxes vary widely
For policymakers considering a SSB tax, there is less consensus on best practice compared to tobacco and alcohol taxes. The design of SSB taxes – e.g. how they are structured or what products are taxed – varies widely across the world. And the design of these taxes is closely linked to their effectiveness. To date, comparisons and monitoring of these designs and their effectiveness has been stymied by the lack of a comprehensive source on SSB taxes.
To address this gap, the World Bank Group has launched a new Global SSB Tax Database as part of its work on health taxes and healthy diets. The database is an open-access repository of standardized data on all verified SSB taxes worldwide, aimed at supporting learning and informing the development of best practice in SSB taxes. Users can explore the data using interactive maps and data stories. This blog highlights key findings from the latest February 2023 update of the database, which are explored in more depth in a recent paper using the August 2022 version of the database.
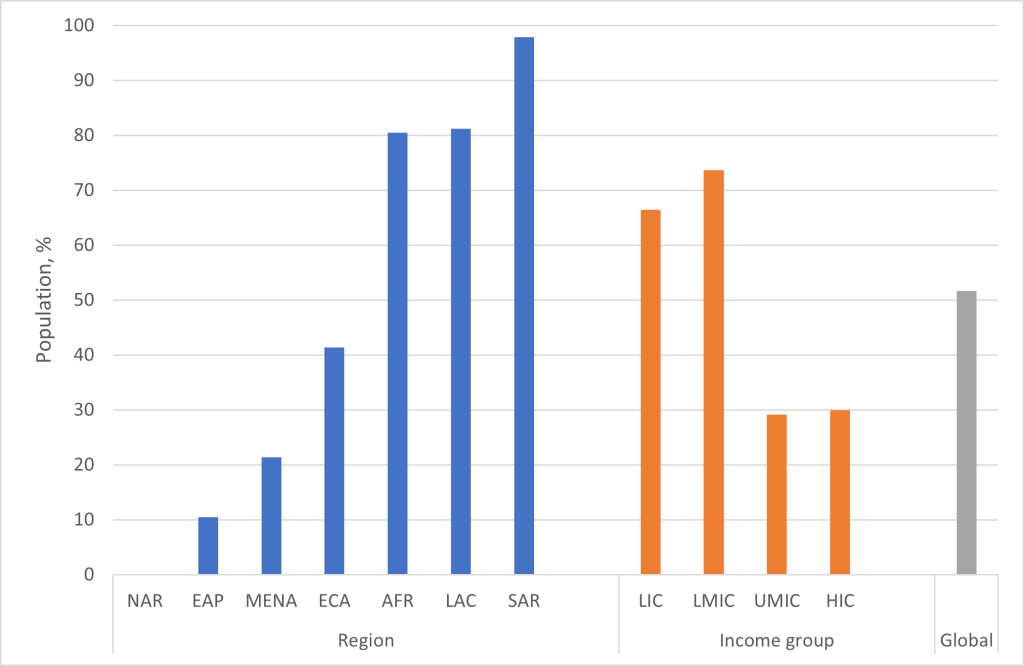
As of February 2023, national SSB taxes were in effect across 106 countries and territories, covering 52% of the world’s population. Moreover, more people in lower-income economies are covered by a SSB tax than higher-income economies. Two in three people living in low-income countries (66%) and three in four people living in lower-middle income countries (74%) are covered by a national SSB tax. This compares to less than one in three people living in upper-middle (29%) and high-income (30%) countries.
Coverage varies substantially by region, highlighting opportunities to make health and revenue gains
In some regions, the vast majority of the population is covered by a SSB tax. For example, nearly all the population in South Asia is covered by a SSB tax (98%), followed by four out of five people in Latin America and the Caribbean (81%), and sub-Saharan Africa (80%). Elsewhere, there are still substantial opportunities for governments to leverage this policy tool for health and revenue gains. For example, less than one out of four people are covered in the Middle East and North Africa (21%), and less than one out of two in Europe and Central Asia (41%). Just one out of ten people are covered by a SSB tax in East Asia and the Pacific (10%).
Figure 1: SSB tax population coverage by region and income group (as of February 2023)
Too many SSB taxes apply to water and need to be better targeted
To be effective, SSB taxes need to discourage consumption of the unhealthy products (i.e. SSBs) by raising their prices relative to healthier alternatives (e.g. unsweetened water). SSB taxes in low and middle-income countries tend to cover a wider range of SSBs, including sweetened milk-based drinks (e.g. chocolate milk) and 100% juices. This is an advantage as it will reduce the consumption of more unhealthy drinks and potentially bring in more revenue. However, often this coverage is too untargeted and includes healthy substitutes such as water. Almost one-third of SSB excise taxes worldwide and almost half of SSB excise taxes in low- and middle-income countries apply to unsweetened bottled water , which we call untargeted taxes. These taxes could be made more effective immediately by excluding water and other healthy alternatives.
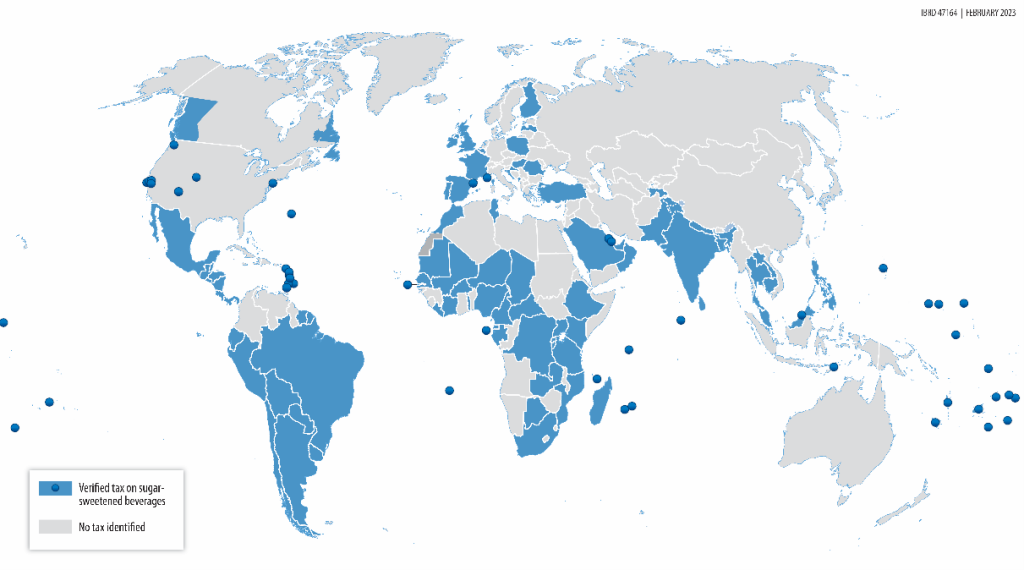
Figure 2: Map of taxes on SSBs worldwide (as of February 2023)
With SSB taxes covering more than half the world’s population, this is no longer a new policy tool . The Global SSB Tax Database highlights many opportunities to further strengthen SSB taxes, enabling policymakers to make use of this cost-effective fiscal tool to raise revenue and improve public health.


Join the Conversation