Where do we stand in our efforts to end extreme poverty worldwide? How much progress have we made towards achieving affordable and clean energy? How can we respond to the human and economic costs of climate change?
The World Bank’s 2023 Atlas of Sustainable Development Goals, published today, offers powerful data insights on the progress and setbacks in our efforts to achieve the Sustainable Development Goals (SDGs) at the midpoint in their implementation. Through immersive, interactive storytelling and compelling, state-of-the-art data visualizations, the 2023 Atlas provides decision-makers, the development community, academics, journalists, and the public with a visual online resource highlighting the role of data in the implementation of the 17 SDGs.
The SDGs, established by the United Nations in 2015, set out a shared global roadmap for peace and prosperity for people and the planet to be achieved by 2030. The goals seek to address many of the world’s greatest challenges, such as eradicating poverty, eliminating hunger, expanding access to education, achieving gender equality, and tackling the climate crisis.
The 2023 Atlas explores relevant targets for each goal and spotlights important trends towards achieving the SDGs, emphasizing how the goals are interconnected. It also shows that many of the goals are impacted by climate change and the COVID-19 pandemic. The 2023 Atlas even allows readers to customize each chapter to track the development of specific countries. And in the spirit of the World Development Report 2021: Data for Better Lives, which promotes open data practices to unlock the full value of data, all the 2023 Atlas’s data, code, and – for the first time – visualizations will be made available for everyone to download and reuse.
Explore three data stories from the 2023 Atlas:
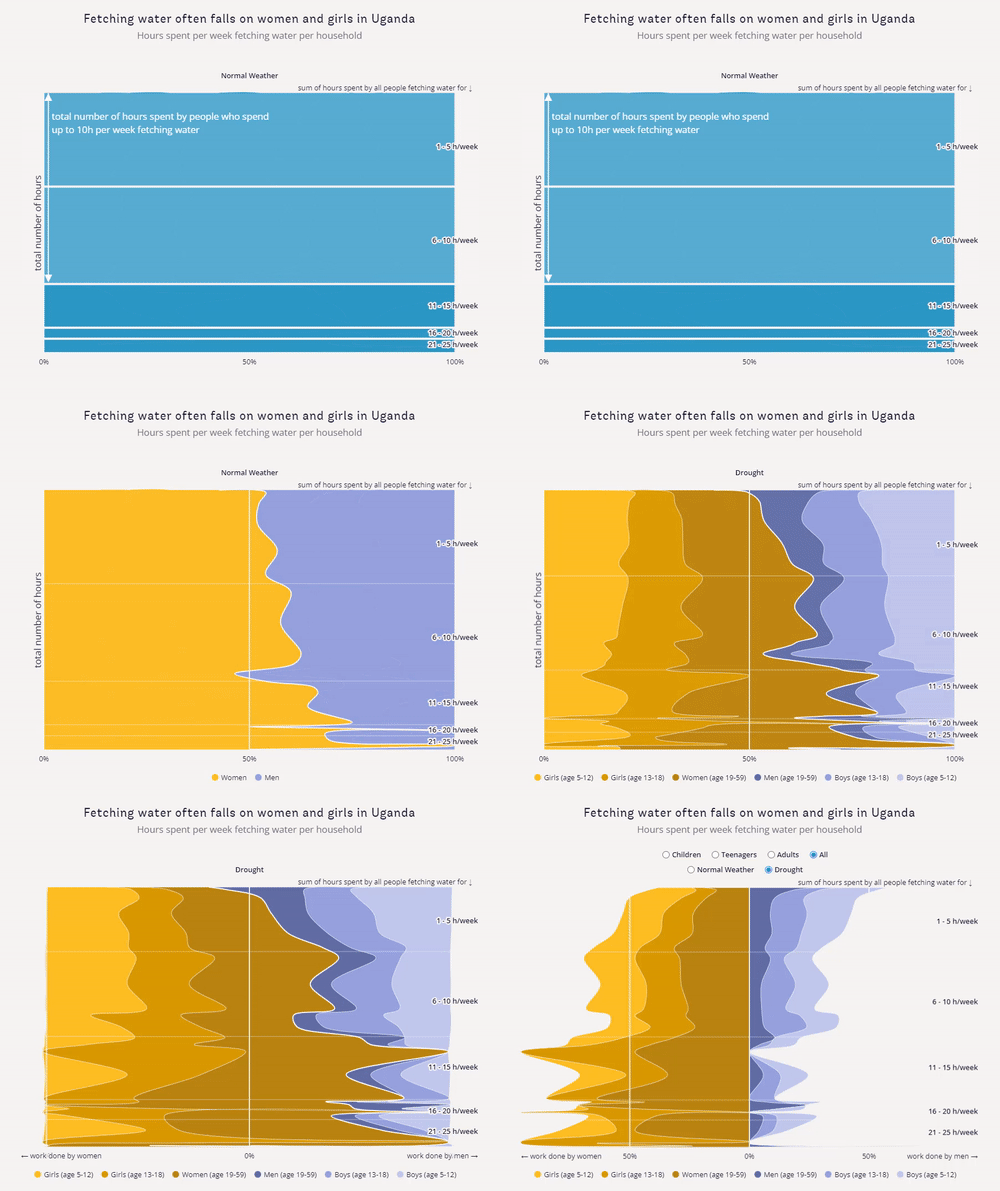
Climate change threatens to worsen gender inequalities.
As a study from Uganda reveals, the burden of fetching water disproportionately affects women and girls. Adult Ugandan women and teenage girls spent the most time – about 4 hours per week – fetching water, while adult men and adolescent boys spent between 1 and 3.5 hours per week, respectively. When there is a drought, women and girls bear all the additional burden of fetching water: adult women spent nearly 20 percent more time on this chore, and for girls, the time spent on this responsibility increased by 40 percent. For men and boys, there was no change compared with normal conditions.
Explore this in the interactive chart here.

Why does this Ugandan example have worldwide implications? Globally, one in four households lacks access to safely managed drinking water within their homes. As climate change leads to more frequent weather events like droughts, these inequalities will likely worsen, leading to fewer options and limited economic opportunities for women and girls.
To read more about what the data reveals regarding the efforts to achieve gender equality and empower all women and girls, particularly on a warming planet, scroll through the data stories and visualizations in Chapter 5 of the 2023 Atlas.
Will countries recover equitably from COVID-19?
The pandemic was a massive shock to economic growth, with global GDP falling the most on record since World War II. Today, 95% of people live in a country with a lower level of GDP than forecast before the pandemic. While growth has resumed, will the economic recovery benefit everyone?
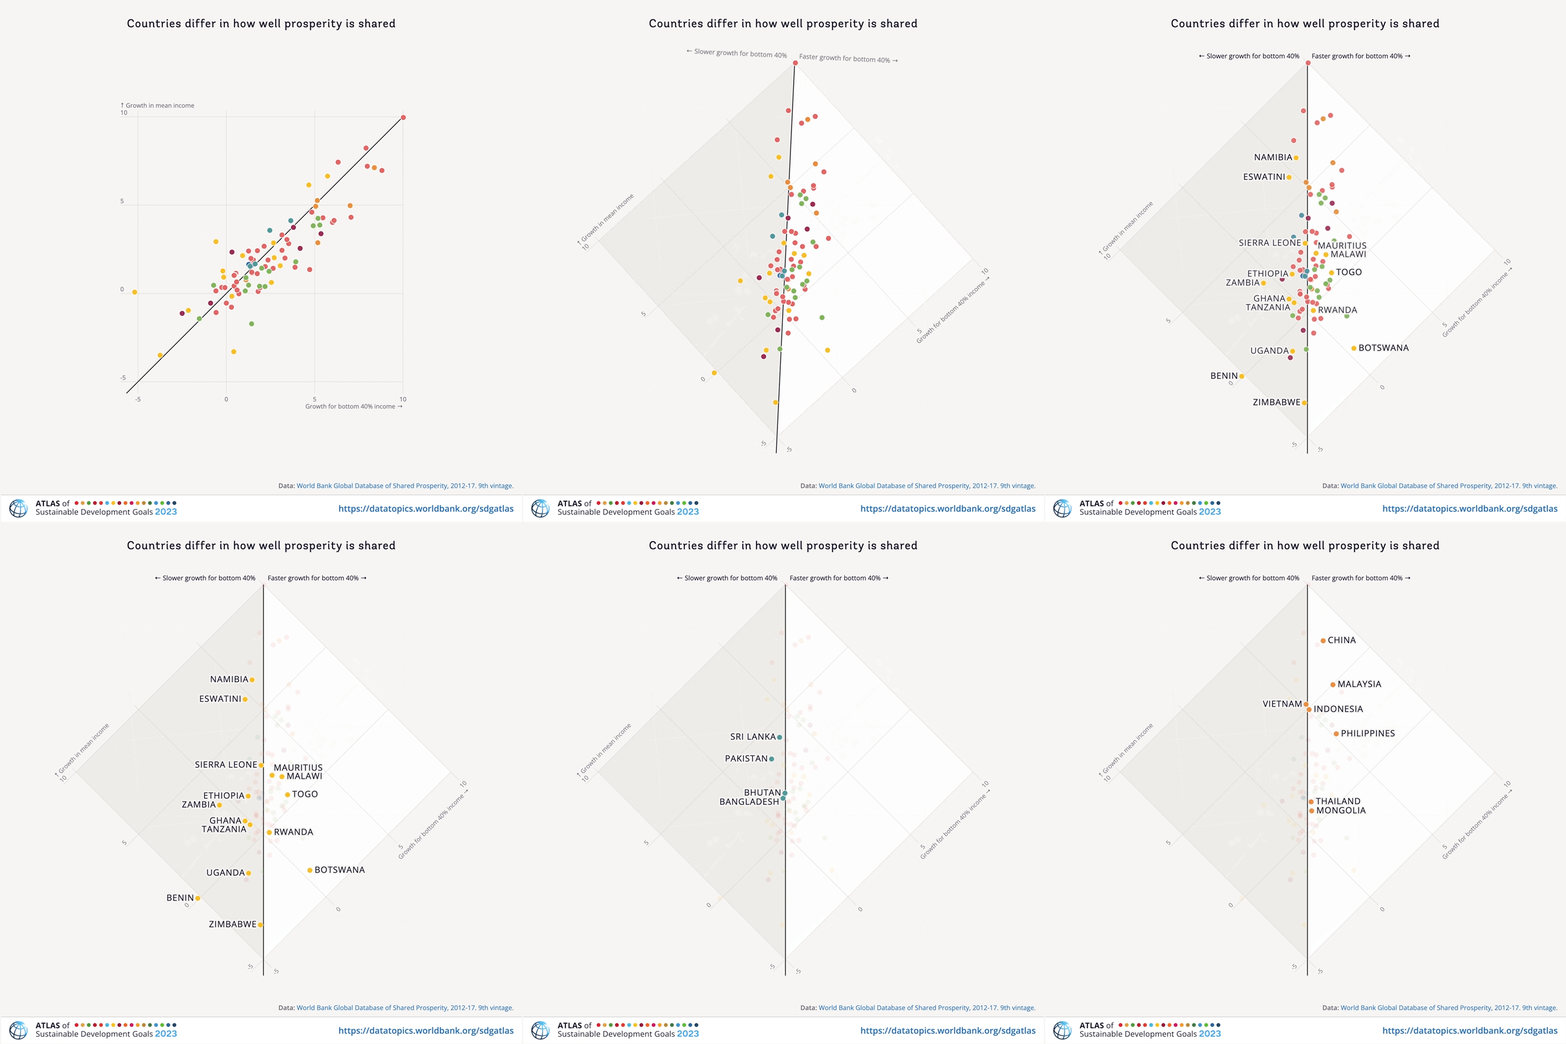
To answer this question, the Atlas looks at latest trends based on the shared prosperity premium, which is the gap between income growth for the bottom 40 percent of households compared to the growth of all households. Places where incomes for the bottom 40 percent grow faster than the overall average have a positive premium. In countries with a negative premium, income growth is slower for the bottom 40 percent.
See how countries (for which data is available) have succeeded in generating broadly shared growth in recent years:

(For the interactive chart, please click here.)
As the data story shows, in 40 percent of countries with data, the bottom 40 percent of income grew slower from 2012 to 2017. While we are still waiting for more recent data to reveal how the pandemic affected these trends, one thing is certain: much work is needed to ensure that the gains in the aftermath of COVID-19 – and other crises like inflation and Russia’s invasion of Ukraine – benefit everyone.
Read Chapter 8 of the 2023 Atlas to learn more about how economic growth can be inclusive and sustainable.
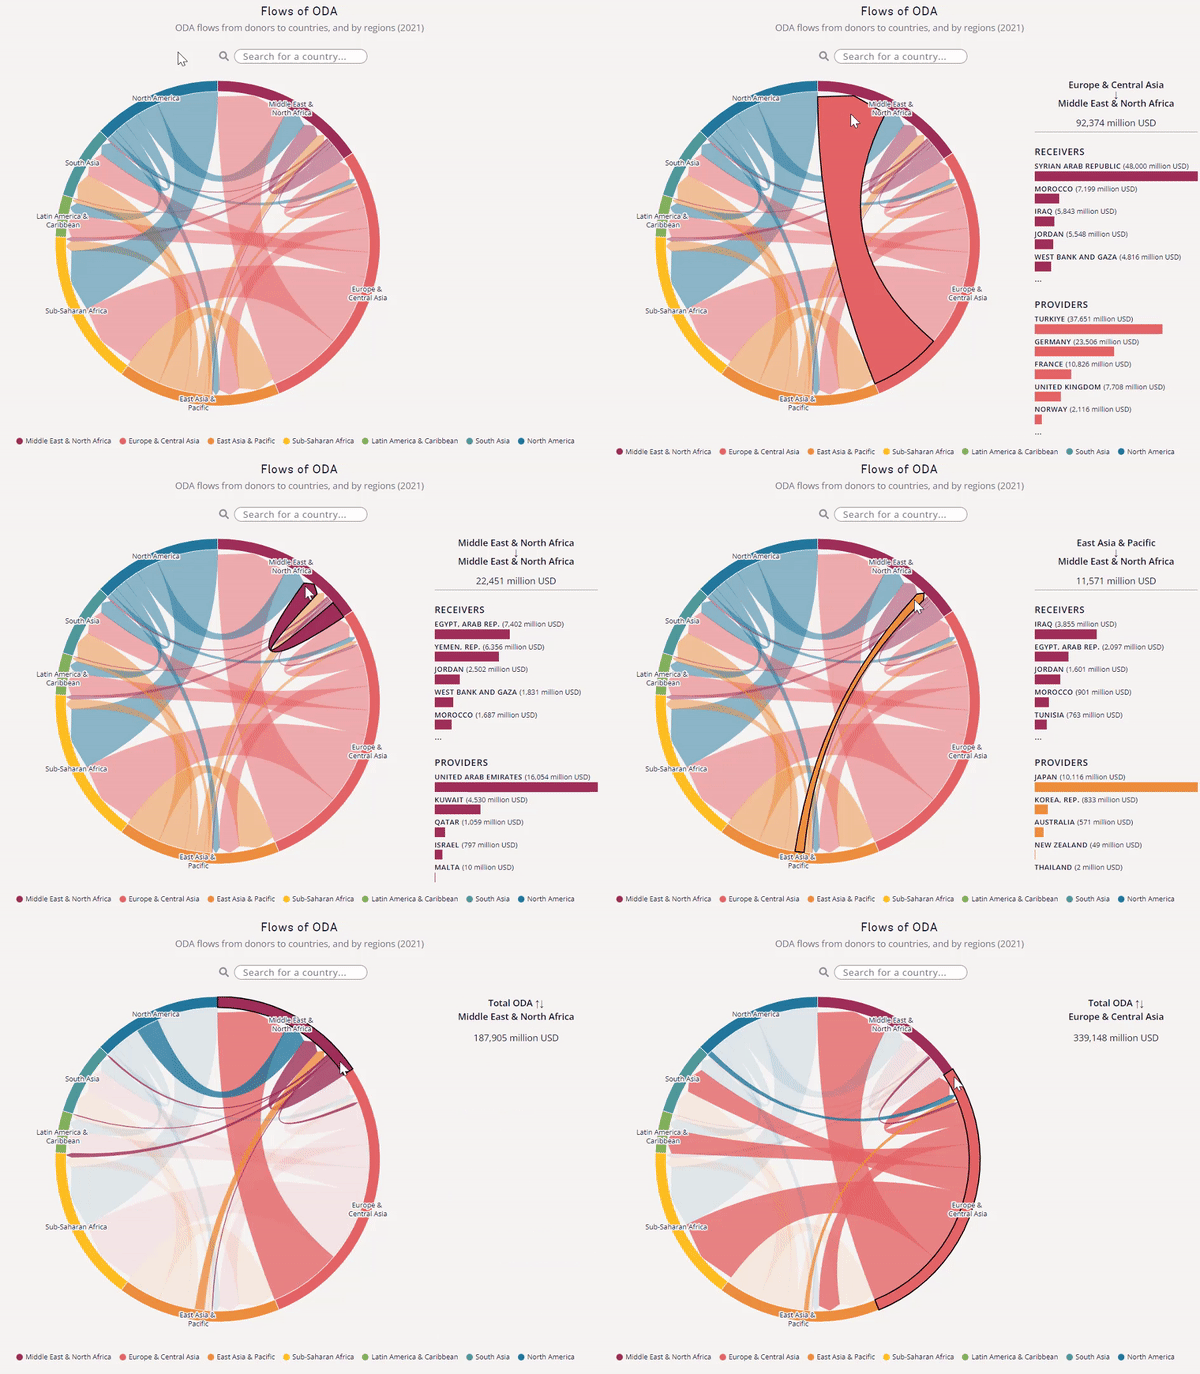
Despite reaching record high levels in 2022, development aid has shifted away from the most vulnerable countries.
In response to COVID-19 and Russia’s invasion of Ukraine, members of the OECD Development Assistance Committee (DAC) – the world’s 31 largest donor countries – have stepped up their support: preliminary data for 2022 indicates that official development assistance (ODA) reached a record high of $211.3 billion, an increase of nearly 28 percent since 2019 in real terms.
However, there is more to this story. Official aid remains modest as a percentage of donor countries’ economies. The share of gross national income (GNI) dedicated to aid in DAC donor countries hovered around 0.3 percent for the past 50 years and reached a 40-year high of 0.36 percent in 2022. This is far from the SDG official target (SDG target 17.2) of allocating at least 0.7 percent of GNI for aid to less wealthy countries.
Despite a year of exceptional growth in aid, preliminary data for 2022 indicates a 0.7 percent decline in bilateral funding for the world’s poorest countries compared to 2021. The implications of this decrease are enormous as these countries face severe structural impediments to sustainable development and have the greatest needs for foreign aid.
Follow the money yourself here. (Hover over the interactive chord diagram or customize your search for a specific country to reveal how international aid flowed during 2015 to 2021.)

Learn more about how global partnerships support progress toward the SDGs in Chapter 17 of the 2023 Atlas.
Explore the 2023 Atlas for even more insights. It can help us understand where we stand in our progress towards the SDGs, underlining the centrality of data to those efforts.


Join the Conversation