How would you define the area of Indonesia’s capital city, Jakarta?
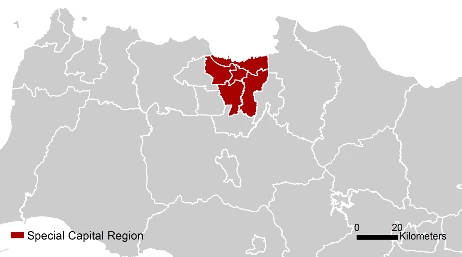
a: Simply using the administrative boundaries of the Special Capital Region of Jakarta?
b: Based on the extent and density of population?
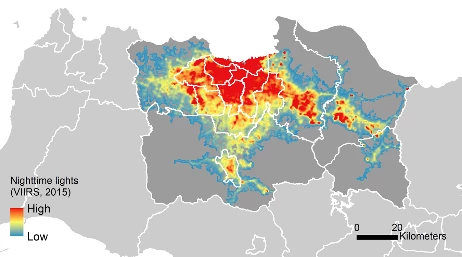
c: Using nighttime lights data?
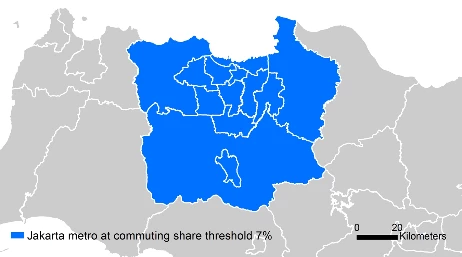
d: Or, what about a definition based on commuting flows as used in the U.S. approach to defining metropolitan statistical areas?
But how to define a metro area?
Defining cities based on their administrative boundaries is often inadequate as these frequently over- or under-state true city areas – few would disagree, for example, that the “true” area of Jakarta is far greater than that of the Special Capital Region. Given the inadequacies of relying on administrative boundaries, experts from a range of disciplines – economics, human geography, and remote sensing – have attempted to develop alternatives, leveraging, in many cases, satellite imagery and high-resolution “gridded” population data sets such as LandScan or GHS-Pop that cover the entire planet.
Despite a proliferation of approaches, however, little is known about how different approaches compare in terms of the areas they define. Likewise, little is known about whether the choice of approach makes a difference to our understanding of key empirical relationships – such as the strength of agglomeration economies (i.e. the strength of productivity benefits associated with a city’s size and density) – relating to the working of cities.
In our recently published working paper, we compare the results from a benchmark “first-best” approach to defining metro areas based on commuting flow data with three other prominent approaches (see table below), which rely on satellite imagery and/or global gridded population data sets.
In doing so, we use Indonesia as a case study, taking advantage of the fact that, unlike most other developing countries, its labor force survey provides data on commuting flows between subnational areas. This allows us to assess how well other approaches do in defining metros compared to the “first-best” approach, which is useful to know for (the many) settings in which commuting data is not available.
However, even with the “first-best” approach, it is necessary to select a threshold commuting flow level to determine whether two subnational areas are sufficiently strongly linked to be considered part of the same metro. Similarly, the other three approaches require their own choices of thresholds and so we also analyze how the choices of thresholds across the different approaches affects the metro areas defined.
Unlike the commuting approach, which directly aggregates subnational administrative units (districts) into metro areas, the three other approaches, which define cities as collections of grid cells of 1 square kilometer or less, require an additional step to map their results to Indonesian districts.
Although the definition of cities using high spatial resolution grid cells would seem to be a key advantage that the other approaches hold over the commuting approach, the reality is that most data, including that necessary to estimate the strength of agglomeration economies, is not available at such a fine spatial scale. Beyond producing pretty maps and generating basic statistics on population and area, this limits the practical usefulness of defining metro areas at the grid-cell level.
To map from metros defined at the grid cell level to the district-level, we always apply the same basic rule: namely, we associate two or more districts with a single urban extent and consider it to be a metro if at least 50 percent of each district’s population belongs to the urban extent. We also test the sensitivity of our results to higher population share thresholds, finding them to be largely robust.
[Download paper: Definition Matters: Metropolitan Areas and Agglomeration Economies in a Large Developing Country]
Three key results
But, except for Jakarta, it always keeps the area of each metro (relatively) small by never aggregating more than five districts. Hence, the number of metros grows from 2 to 39 as we lower the commuting flow threshold from 27 percent (which is when the first metro emerges) to 7 percent, while the average number of districts per metro remains below 3.
Thresholding of nighttime lights works in the opposite way. As the brightness threshold that defines a metro is lowered, new districts are aggregated to existing metros, resulting in the expansion of metros rather than the emergence of new ones. Hence, this approach keeps the number of metros roughly the same – between 8 and 10 – over a wide-range of brightness thresholds.
This results in some metros becoming implausibly large at lower thresholds. In the most extreme case, almost the whole of Java – Indonesia’s most populous island – forms one gigantic metro area. This is very similar to the results obtained when instead using the Agglomeration Index (AI), which was first introduced in the 2009 World Development Report, to define metro areas.
In the case of the cluster algorithm, switching from the high-density cluster (HDC) to the urban cluster (UC) set of thresholds increases both the number and sizes of metros. But a common feature of all three non-commuting approaches, particularly at lower thresholds, is that they yield a small number of very large metros on Java.
Overall, the three non-commuting approaches that rely on satellite imagery and/or gridded population data show, at best, only a moderate level of agreement with the “first-best” commuting approach to defining metros. This moderate (or worse) level of agreement stems from how each approach defines the peripheries of metro areas. Different approaches show strong agreement around what most Indonesians would recognize as the metro cores. However, as the below figure shows for Surabaya, there is far less agreement on what constitutes a metro’s periphery.
Following what urban economists consider to be a standard approach to estimation, we find that while the estimated agglomeration wage premium is always positive and significant, its estimate ranges from 4.7 percent to 6.6 percent depending on the precise definition of metros adopted. That is, all else being equal and depending on the definition adopted, a worker can expect to earn a 4.7 - 6.6 percent higher wage by working in a metro that is twice as large.
One key result is that, compared to the “first-best” commuting approach, adopting one of the three other metro definition approaches may lead to more biased estimates of the agglomeration wage premium than not doing anything at all to aggregate subnational areas into metros. Thus, in our baseline regression specification, defining metro areas simply as districts and doing nothing at all to aggregate gives an estimated agglomeration wage premium of 6.6 percent.
This is identical to the estimate obtained when using the commuting approach with our preferred commuting flow threshold of 7 percent. By contrast, other approaches yield smaller estimates of the agglomeration wage premium. This is especially so when the other approaches use relaxed thresholds that cause them to identify unreasonably large metro areas.
So, what is the best approach to defining metro areas?
To summarize, the definition of metro areas matters for the identification of their boundaries, which, in turn, matters both for policy and for the estimation of key empirical relationships that are fundamental to our understanding of how urban economies work.
While a commuting approach is, in principle, to be preferred, its adoption is not feasible for the many developing countries for which commuting data simply does not exist. In this context, alternative approaches based on satellite imagery and gridded population data sets offer an enticing alternative.
Nevertheless, the alternative should always be chosen with great caution.
As our work shows, using a satellite imagery or gridded population data approach may well result in larger biases in estimated relationships, which, in turn, can affect our evaluation of the benefits of policies, such as transit-oriented development, which impact urban density, than simply relying on data for cities as defined by their official administrative boundaries. This is particularly so for densely populated countries such as Indonesia where such alternative approaches generate misleadingly large metro areas which fail to represent functional labor markets.
This blog post is based on the recently published working paper, "Definition Matters: Metropolitan Areas and Agglomeration Economies in a Large Developing Country” by Maarten Bosker , Jane Park and Mark Roberts. Click here to download the full paper.
READ MORE:
a: Simply using the administrative boundaries of the Special Capital Region of Jakarta?
b: Based on the extent and density of population?
c: Using nighttime lights data?
d: Or, what about a definition based on commuting flows as used in the U.S. approach to defining metropolitan statistical areas?
|

|
|
|
Globally, a growing number of cities spill across their administrative boundaries, meaning that many urban issues now need to be addressed at a metropolitan level. However, to do this, it is first necessary to delineate the “true” extent of a metro area. How else, after all, will policymakers be able to identify which local governments need to work together to provide transport and other essential public services?
But how to define a metro area?
Defining cities based on their administrative boundaries is often inadequate as these frequently over- or under-state true city areas – few would disagree, for example, that the “true” area of Jakarta is far greater than that of the Special Capital Region. Given the inadequacies of relying on administrative boundaries, experts from a range of disciplines – economics, human geography, and remote sensing – have attempted to develop alternatives, leveraging, in many cases, satellite imagery and high-resolution “gridded” population data sets such as LandScan or GHS-Pop that cover the entire planet.
Despite a proliferation of approaches, however, little is known about how different approaches compare in terms of the areas they define. Likewise, little is known about whether the choice of approach makes a difference to our understanding of key empirical relationships – such as the strength of agglomeration economies (i.e. the strength of productivity benefits associated with a city’s size and density) – relating to the working of cities.
In our recently published working paper, we compare the results from a benchmark “first-best” approach to defining metro areas based on commuting flow data with three other prominent approaches (see table below), which rely on satellite imagery and/or global gridded population data sets.
| Approach | Source | How to define metro area? | Thresholds |
|---|---|---|---|
| 1. Commuting flow approach | Duranton (2015) | A collection of districts with strong commuting ties which form a functional labor market. | Commuting flow threshold, at every 0.5% between 7% – 27% |
| 2. Agglomeration index | Uchida & Nelson (2008) | A group of relatively densely populated grid cells within a reasonable travel time of a sizeable “core” city. | Core: Population ≥ 50,000 Density ≥ 150 people/ km2 Travel time from the core ≤ 60 min |
| 3. Cluster algorithm | Dijkstra & Poelman (2014) | A spatially contiguous group of relatively densely populated grid cells, for which the aggregate population exceeds a threshold level. | High-density cluster (HDC): Density of each cell ≥ 1,500 people/km2 Aggregate population ≥ 50,000 Urban cluster (UC): Density of each cell ≥ 300 people/km2 Aggregate population ≥ 5,000 |
| 4. Nighttime lights (NTL) thresholding | A spatially contiguous group of brightly lit grid cells. | Brightness threshold at every 5th percentile within national range of NTL brightness (0 – 1,340.44) |
However, even with the “first-best” approach, it is necessary to select a threshold commuting flow level to determine whether two subnational areas are sufficiently strongly linked to be considered part of the same metro. Similarly, the other three approaches require their own choices of thresholds and so we also analyze how the choices of thresholds across the different approaches affects the metro areas defined.
Unlike the commuting approach, which directly aggregates subnational administrative units (districts) into metro areas, the three other approaches, which define cities as collections of grid cells of 1 square kilometer or less, require an additional step to map their results to Indonesian districts.
Although the definition of cities using high spatial resolution grid cells would seem to be a key advantage that the other approaches hold over the commuting approach, the reality is that most data, including that necessary to estimate the strength of agglomeration economies, is not available at such a fine spatial scale. Beyond producing pretty maps and generating basic statistics on population and area, this limits the practical usefulness of defining metro areas at the grid-cell level.
To map from metros defined at the grid cell level to the district-level, we always apply the same basic rule: namely, we associate two or more districts with a single urban extent and consider it to be a metro if at least 50 percent of each district’s population belongs to the urban extent. We also test the sensitivity of our results to higher population share thresholds, finding them to be largely robust.
[Download paper: Definition Matters: Metropolitan Areas and Agglomeration Economies in a Large Developing Country]
Three key results
- Many smaller metros versus a few large ones.
But, except for Jakarta, it always keeps the area of each metro (relatively) small by never aggregating more than five districts. Hence, the number of metros grows from 2 to 39 as we lower the commuting flow threshold from 27 percent (which is when the first metro emerges) to 7 percent, while the average number of districts per metro remains below 3.
Thresholding of nighttime lights works in the opposite way. As the brightness threshold that defines a metro is lowered, new districts are aggregated to existing metros, resulting in the expansion of metros rather than the emergence of new ones. Hence, this approach keeps the number of metros roughly the same – between 8 and 10 – over a wide-range of brightness thresholds.
This results in some metros becoming implausibly large at lower thresholds. In the most extreme case, almost the whole of Java – Indonesia’s most populous island – forms one gigantic metro area. This is very similar to the results obtained when instead using the Agglomeration Index (AI), which was first introduced in the 2009 World Development Report, to define metro areas.
In the case of the cluster algorithm, switching from the high-density cluster (HDC) to the urban cluster (UC) set of thresholds increases both the number and sizes of metros. But a common feature of all three non-commuting approaches, particularly at lower thresholds, is that they yield a small number of very large metros on Java.
- Strong agreement on cores, but not on peripheries.
Overall, the three non-commuting approaches that rely on satellite imagery and/or gridded population data show, at best, only a moderate level of agreement with the “first-best” commuting approach to defining metros. This moderate (or worse) level of agreement stems from how each approach defines the peripheries of metro areas. Different approaches show strong agreement around what most Indonesians would recognize as the metro cores. However, as the below figure shows for Surabaya, there is far less agreement on what constitutes a metro’s periphery.

- Definition matters for the estimated size of the agglomeration wage premium.
Following what urban economists consider to be a standard approach to estimation, we find that while the estimated agglomeration wage premium is always positive and significant, its estimate ranges from 4.7 percent to 6.6 percent depending on the precise definition of metros adopted. That is, all else being equal and depending on the definition adopted, a worker can expect to earn a 4.7 - 6.6 percent higher wage by working in a metro that is twice as large.
One key result is that, compared to the “first-best” commuting approach, adopting one of the three other metro definition approaches may lead to more biased estimates of the agglomeration wage premium than not doing anything at all to aggregate subnational areas into metros. Thus, in our baseline regression specification, defining metro areas simply as districts and doing nothing at all to aggregate gives an estimated agglomeration wage premium of 6.6 percent.
This is identical to the estimate obtained when using the commuting approach with our preferred commuting flow threshold of 7 percent. By contrast, other approaches yield smaller estimates of the agglomeration wage premium. This is especially so when the other approaches use relaxed thresholds that cause them to identify unreasonably large metro areas.
So, what is the best approach to defining metro areas?
To summarize, the definition of metro areas matters for the identification of their boundaries, which, in turn, matters both for policy and for the estimation of key empirical relationships that are fundamental to our understanding of how urban economies work.
While a commuting approach is, in principle, to be preferred, its adoption is not feasible for the many developing countries for which commuting data simply does not exist. In this context, alternative approaches based on satellite imagery and gridded population data sets offer an enticing alternative.
Nevertheless, the alternative should always be chosen with great caution.
As our work shows, using a satellite imagery or gridded population data approach may well result in larger biases in estimated relationships, which, in turn, can affect our evaluation of the benefits of policies, such as transit-oriented development, which impact urban density, than simply relying on data for cities as defined by their official administrative boundaries. This is particularly so for densely populated countries such as Indonesia where such alternative approaches generate misleadingly large metro areas which fail to represent functional labor markets.
This blog post is based on the recently published working paper, "Definition Matters: Metropolitan Areas and Agglomeration Economies in a Large Developing Country” by Maarten Bosker , Jane Park and Mark Roberts. Click here to download the full paper.
READ MORE:
- Subscribe to our Sustainable Communities newsletter
- Follow @WBG_Cities on Twitter





Join the Conversation