 انځور: نړیوال بانک
Imagine growing up in the foothills of the Hindu Kush mountains of Afghanistan. Your family cultivates fruit and wheat, you attend school each day, and you suffer neither loneliness nor hunger.
At the same time, the nearest health center is more than an hour away, a trip to the market is more of a trek, and access to services may be limited, so some of your classmates do not get the assistance they need.
Now imagine raising a family in a middle-class neighborhood in Kabul or Herat. Your neighbors seem to have enough to eat, spare money to buy a few new clothing items with each new season, and the ability to travel from time to time to visit family.
However, you struggle to earn enough money to feed, clothe, and keep the electricity on at night. These are the competing realities of life in Afghanistan, where a family’s circumstances are influenced by both geography and happenstance .
In this context, sharp divisions in welfare can occur within small areas, posing severe challenges in service delivery and market integration. However, traditional information on poverty, based on household surveys, is limited due to difficulties in accessing households and getting reliable information, and we do not know much about the welfare of Afghans at the district level or below.
For this reason, the World Bank partnered with the National Statistics and Information Authority (NSIA) of Afghanistan to produce the first set of poverty maps for Afghanistan for the provinces of Kabul and Herat.
What are poverty maps?
Poverty maps are an important instrument to help policymakers understand poverty at a granular level , enabling them to better design programs to improve public service delivery for the poorest.
Poverty mapping combines the strengths of household survey and census data and involves modeling a relationship between household welfare, measured by consumption per capita, and various household, individual, and location characteristics.
The model is then applied to the census data to impute the welfare for all households. The information is then visualized to illustrate differences in poverty across communities.
Poverty mapping typically relies on census data. However, Afghanistan is among a handful of countries without any recent census data, so the NSIA undertook large-scale household surveys — the Socio-Demographic and Economic Surveys (SDES), which cover about half of all households in each of the provinces, to get more up-to-date socio-economic information on households.
Due to the security situation, only 13 provinces – Kabul, Kapisa, Parwan, Baghlan, Bamyan, Takhar, Samangan, Balkh, Ghor, Daykundi, Herat, Badghis, and Nimroz - could be covered by the SDES and some of them only partially.
With this information in hand, we created a sample poverty map to gauge whether poverty mapping could be a relevant policy tool to identify where the most disadvantaged populations live and to strengthen social programs in the absence of census data, using the Afghanistan Living Conditions Survey 2016-17 (ALCS) and the SDES data.
We focused on two of the largest, most urban provinces — Herat and Kabul provinces — which together account for about a quarter of Afghanistan’s population. Despite the lack of census data, we were able to reliably estimate poverty for districts as well as smaller administrative units in urban areas of Afghanistan (nahias) within Kabul and Herat districts.
Poverty mapping combines the strengths of household survey and census data and involves modeling a relationship between household welfare, measured by consumption per capita, and various household, individual, and location characteristics.
What do poverty maps tell us about welfare in Kabul and Herat provinces?
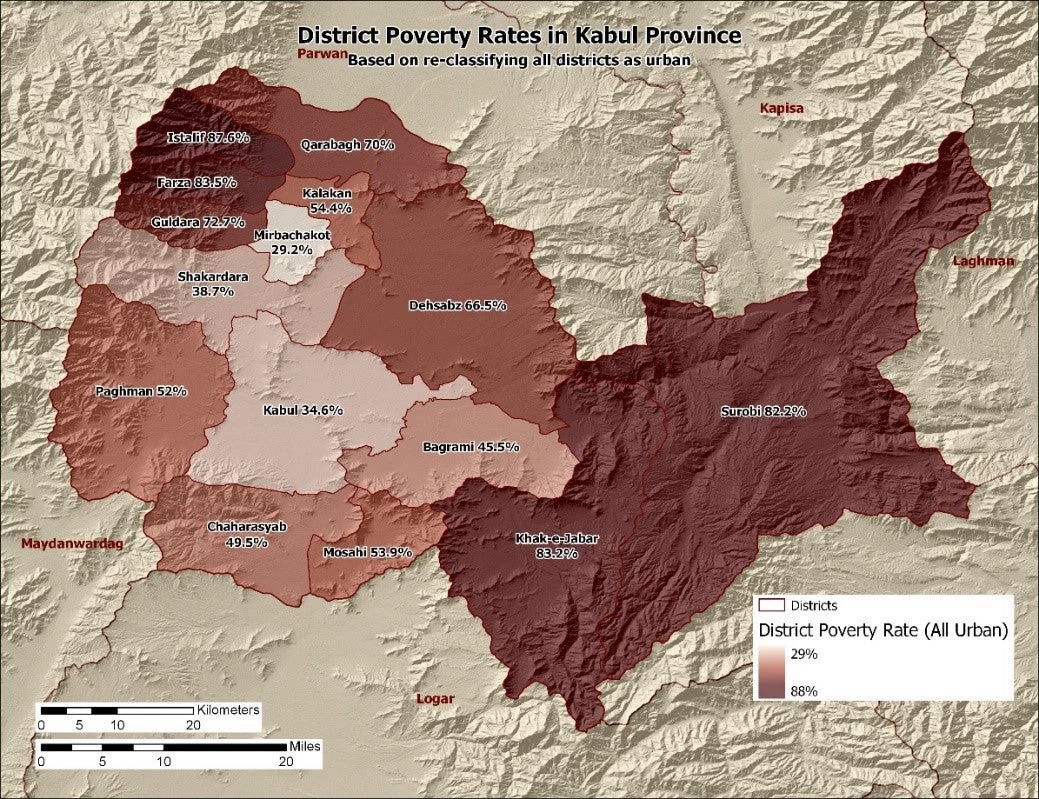
The poverty maps reveal a diverse picture in welfare within provinces (Map 1). As we move from the province down to the district level, pockets of poverty and prosperity come into focus.
With respect to poverty density, Kabul and Herat districts (both provincial centers) are home to large concentrations of poor people. In Kabul district, the poverty rates are not particularly high, but the high population density means that there are over 1 million poor people in the district. Similarly, Herat district has relatively modest poverty rates, but has the highest number of poor people in the province, with over 320,000.

How do poverty maps help us define policies?
The poverty maps we developed in Afghanistan are useful in understanding the geographic distribution of poverty in Kabul and Herat provinces and can help policymakers decide where to allocate scarce resources so they help people that need them most.
For example, maternal and child health programs can be provided to poor families that have been previously overlooked, water and sanitation programs can be deployed to less affluent sections of a neighborhood, and agricultural grants can be transferred from one area to another based on need.


Join the Conversation