As one of over 20 million people who work and live in Beijing, China, I used to find commuting to work in rush-hour traffic rather painful. However, things have changed dramatically since last year. Now I can bypass the traffic by riding a shared bike to the closest metro station and make better use of public transit. Similar change is happening to my family and friends.
The
unprecedented booming of dockless shared bikes in China presents a promising solution to the “last-mile problem” that has perplexed city planners for years: providing easier access to the mass transit system while ensuring good ridership. Thanks to the GPS tracking device installed on thousands of dockless shared bikes, city planners in China are now equipped with new and better information to analyze the demand for—and the performance of—public transit systems. For the first time, city managers can clearly map out the attractiveness and accessibility of metro stations by analyzing individual-level biking trips.
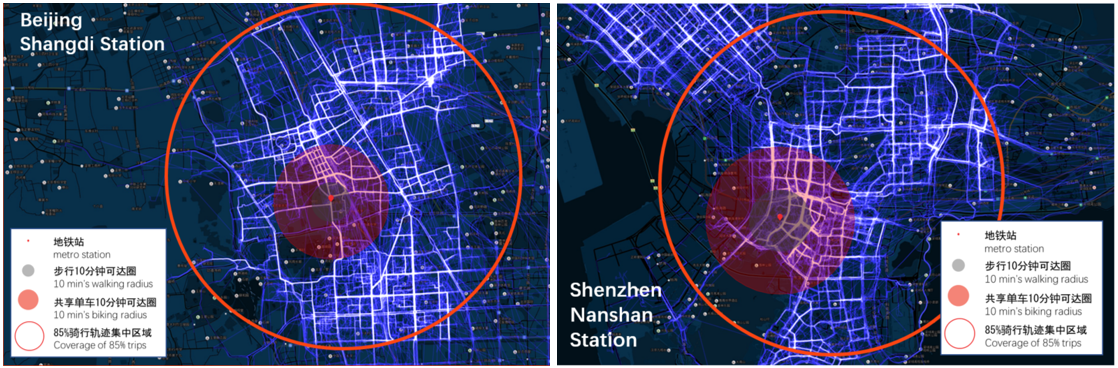
Revisiting the scope of TOD. A commonly accepted textbook definition of the core area of TOD is an 800-meter radius around the metro station or other types of public transit hubs. This definition is based on the distance that can be reached by a 10-minute walk. However, the actual catchment of a metro station can reach a 2-3 km radius when biking prevails, as in Demark and Netherland. Our analysis illustrates that a big chunk of biking trips around metro stations even go beyond the 3km radius (see bright blue traces in Figure 1 below). This indicates that the spatial scope of planning and design around the metro stations should be contextualized. Accordingly, the price premium associated with adjacency to public transit service is more likely to be shared by a broader range of nearby real estate properties than expected.
Figure 1: Biking traces around major metro station in Beijing (left) and Shenzhen (right).
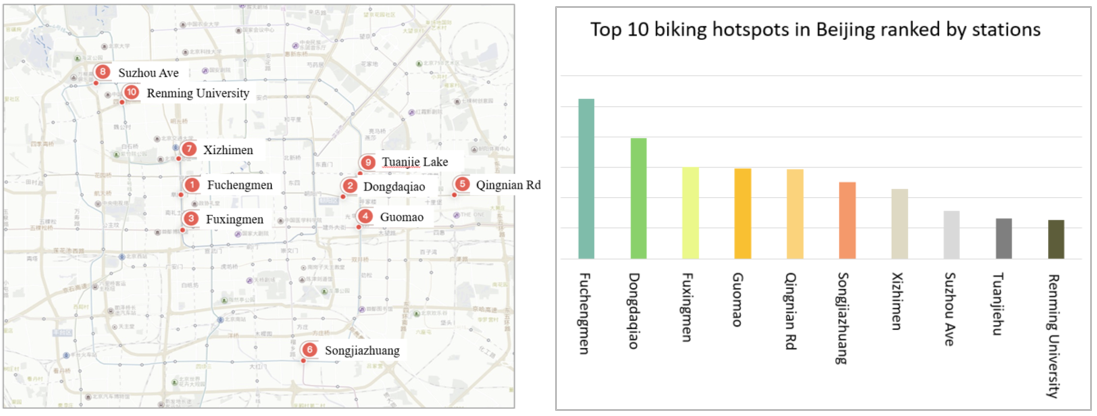
Identifying TOD priorities and development prototypes. Bike ridership can be an indicator that helps identify the districts with great potential of becoming TOD communities. Figure 2 shows the top 10 hotspots of shared-bike trips in Beijing ranked by metro station. These areas are normally job centers, shopping centers, multi-mode transport hubs, or high-density residential communities. When cities develop their long-term TOD visions, these areas are worth extra attention and can be used as pilots for testing development strategies based on various combinations of land uses, economic activities, and public transit services. The methodology of categorizing TODs has been elaborated in a World Bank book titled “Transforming the Urban Space through TOD: the 3V Approach.”
Figure 2: Top 10 hotspots for shared-bike trips in Beijing.
Monitoring the performance of TOD over time and across/within cities. It has been a challenge to evaluate the performance of TOD but big data of shared-bike trips now enables benchmarking and comparative analysis. For instance, biking speed is strongly correlated with the physical environment near metro stations—whether there is dedicated biking lanes and signal control prioritizing non-motorized vehicles. Interestingly, in Beijing, people consistently bike faster around stations on Line 1 than on Line 13 (Figure 3 left). A possible reason is that Chang’an Avenue along Line 1 offers a bike-friendly environment, featuring wide, dedicated biking lanes and strict law enforcement against illegal parking (Figure 3 right).
Figure 3: Biking speed around stations on Line 1 vs. Line 13 in Beijing (left) and a dedicated bike lane on Chang’an Avenue in the city (right). (Unit: m/min)
Moreover,
bike sharing big data can be used to monitor road safety improvement over time and to analyze travel patterns and preference of specific groups of bikers, such as senior people and female users. These are some of thetopics we will explore in our future studies over the implementation period of the GEF sustainable cities project. We look forward to sharing new findings with you soon.
Data analysis was conducted by Dr. Dafei Yin and his team comprising Ms. Yaning Xue, Dr. Yong Bai, Mr. Deshan Tian, and Mr. Zhuang Sun at Mobike. Special thanks to Ms. Ting Li at Mobike for facilitating the coordination.
Thank you for choosing to be part of the Sustainable Cities community!
Your subscription is now active. The latest blog posts and blog-related announcements will be delivered directly to your email inbox. You may unsubscribe at any time.
The e-mail address: [email] is already subscribed for newsletters.


Join the Conversation