This blog is part of a series accompanying the Atlas of Sustainable Development Goals (SDG) 2017. In response to frequent questions from those trying to gain familiarity with the monitoring method of SDG target 6.1, we use this blog to elaborate on the overview presented in the Atlas.
Here we are looking just at the new water indicator: 'The percentage of the population using safely managed drinking water services', defined as an MDG-style improved drinking water source, which is:
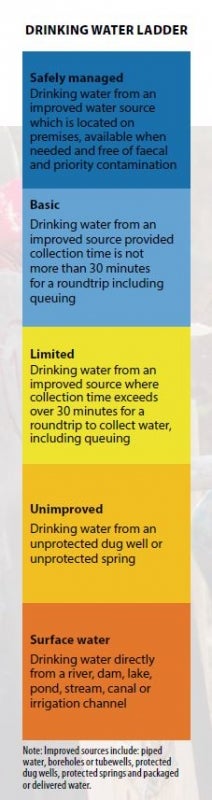
- located on premises
- available when needed, and
- compliant with fecal (zero E.coli in 100mL sample of the household's source of drinking water) and priority chemical standards
These changes reflect evolving global consensus on what can best be monitored to support development. They are designed to denote opportunities: representing the full water cycle and fecal-oral chain, quantifying issues that were less visible through MDG-lenses, and informing action to meet domestic targets as well as the World Bank Group Twin Goals and the SDGs. That is, so long as the data is collected.
Until household surveys integrate the additional measurements, data constraints mean that only limited insights are yet possible on how the shift to the SDG framework will play out in various countries. As outlined in a recent blog, an initiative led by the World Bank's Water and Poverty Equity Global Practices - called the Water Supply, Sanitation, and Hygiene (WASH) Poverty Diagnostic - is supporting rollout of the new SDG measurements. The Diagnostics have helped not just highlight evidence gaps but also successfully developed partnerships collecting critical SDG measurements in Ethiopia, Tajikistan, Nigeria, DRC, and West Bank and Gaza, as well as Ecuador.
The Diagnostic has also been engaging with countries to help relate their historical data to the new framework. As with the data production, this is mutually informed by the WHO/UNICEF Joint Monitoring Programme for Water Supply and Sanitation (JMP), helping ease uptake of the results in official SDG monitoring.
There are straightforward elements to this: MDG-style "improved" drinking water, the "on premises" component of the MDG-period "piped water on premises", contribute some of the building blocks of SDG classification "safely managed".
Many countries also have some data on whether a drinking water source was within 30 minutes roundtrip versus farther afield. Although not part of the binary SDG indicator, this will routinely be used to distinguish "basic" from worse drinking water. Imagine that your daily life relied on water fetched from over 30 mins away!
"Available when needed" and "compliant with fecal and priority chemical standard" are new to the global monitoring framework.
The partial SDG monitoring data that does exist, along with common sense, helps us understand that the number (and percentage) of people verified as having the new type of access falls. But the key element to raising coverage among the various populations is myriad and less predictable without data. This Figure 2 expands the Figure 6c presented in the Atlas:
This draft analysis is based on the most comprehensive and latest dataset available at the time of analysis for each country: Panama MICS13, Ecuador ENEMDU2016, Guatemala ENCOVI14, India NSS12, Pakistan HIES2014, Indonesia SUS2013, Bangladesh MICS2012-13, Tajikistan WPD2017, Niger DHS2012 and MICS/DHS2006, Haiti DHS2012, Nigeria NWSS2015, Tanzania DHS2015-16, West Bank and Gaza LGPA2016, Mozambique OIF2015, Yemen HBS2014, DRC DHS2014 and WPD2016, and Ethiopia ESS2016. The JMP will issue the official SDG estimates in the coming months based on all datasets available per country.
Notes: Each consecutive indicator adds a stricter criterion, hence each should be expected to be lower than the former. Safely managed adds the criterion that the source is "free of contamination". Whereas data on the first three indicators have long been collected in many countries, some countries do not yet have measurements on the last two.
Bangladesh: "free of contamination" component is adjusted not just for E.coli but also for the nationally-relevant chemical contaminant arsenic.
Where proxies are used instead of ideal measure:
Bangladesh: There is no available data on the "available when needed" component but the "safely managed" estimate can still be considered preliminary, based on JMP guidance.
DRC: proxy "available when needed" measure is based on "less than a full day of interruption in the past two weeks" and proxy "free of contamination" measure "free of E.coli at point-of-use" were used, both from the best performing WPD survey site.
Nigeria: the average contamination by thermotolerant coliforms in the wet and dry seasons is used as a proxy for "safely managed water.
Pakistan: proxy "available when needed" measure is based on HIES2015 % of people reporting their source is available is at least 12 hrs per day, among those drinking piped water
Panama: proxy "available when needed" measure is based on MICS2013 % of people reporting that in the dry season their source is available "part of the day" or "24 hrs per day", among those drinking piped water on premises. This denominator is the far majority of the ideal denominator.
17 Diagnostics countries are ranked by access to the MDG style "improved" drinking water. Considering also the criteria of "on premises" would bump the third top performer into eighth place.
This matters because resources are finite – the criteria by which you prioritize efforts can change everything. Application of the new SDG lenses can systematize insights useful to countries and the international community for defining and verifying service provision efforts[1] towards universal access.
The JMP will release the first global baseline assessment in the coming months. This will help highlight where evidence gaps exist. Then the first opportunities need to be found for collecting the necessary information, making sense of it alongside existing data to build a good understanding of the baseline situation. Without such evidence how can we all plan to reach universal access by 2030?


Join the Conversation