Global poverty estimates were updated today on the Poverty and Inequality Platform (PIP). This update includes only two changes to the data (more details here):
- As previously announced, the September PIP update moves from the 2011 Purchasing Power Parities (PPPs) to the 2017 PPPs to estimate global poverty and determine the international poverty line. PPPs are the principal data used to convert different currencies into a common, comparable unit and are used to account for price differences across countries. PPPs are periodically revised to incorporate more up-to-date international price comparisons. While the default estimates now use the 2017 PPPs, users can still switch to the 2011 PPPs legacy series.
- We now include five new rounds of survey data for India. Before this update, the latest data for India was from 2011/12, severely limiting our ability to estimate poverty in the country, the South Asia region, and the world. Thanks to the new data, we can now publish poverty estimates for South Asia for the period after 2014 and a global poverty estimate for 2019. These data replace earlier estimates that were based on extrapolations of the 2011/12 survey.
As a result of the adoption of the 2017 PPPs, the global poverty lines have been revised: The international poverty line, used to define extreme global poverty, is now revised to US$2.15 from US$1.90. Poverty lines for other sets of countries have also been revised upwards. The poverty line for lower middle-income countries (LMICs) has moved to US$3.65 from US$3.20, while the poverty line for upper middle-income countries (UMICs) has moved to US$6.85 from US$5.50.
In a nutshell, the 2017 PPPs by themselves marginally reduce global extreme poverty in recent years, which is more than offset by the new estimates for India, such that on net global poverty increases slightly in 2018. The previously published global extreme poverty rate in 2018 is now revised slightly up from 8.7 to 8.9 percent (the number of poor people increases from 659 to 674 million, see table below). It is important to note that this comparison looks at the overall effect, comparing the data published in June 2022 (using 2011 PPPs and a $1.90 poverty line) with the new estimates (using the 2017 PPPs, a $2.15 poverty line, and new data for India).
Poverty estimates for 2018, changes between June 2022 and September 2022 vintages by region and poverty lines
Note: Table compares the poverty estimates published in June 2022 with the new estimates published in September 2022. The June 2022 estimates are in 2011 PPPs using poverty lines of $1.90, $3.20, and $5.50. The September 2022 numbers use 2017 PPPs and the new poverty lines of $2.15, $3.65, and $6.85. In June 2022, no estimate for South Asia was available because of a lack of survey coverage (see PIP’s coverage rule). With the September 2022 data, survey coverage for low- and lower-middle-income countries in 2018 is 87.0%. The African sub-regions follow the World Bank’s new administrative regions.
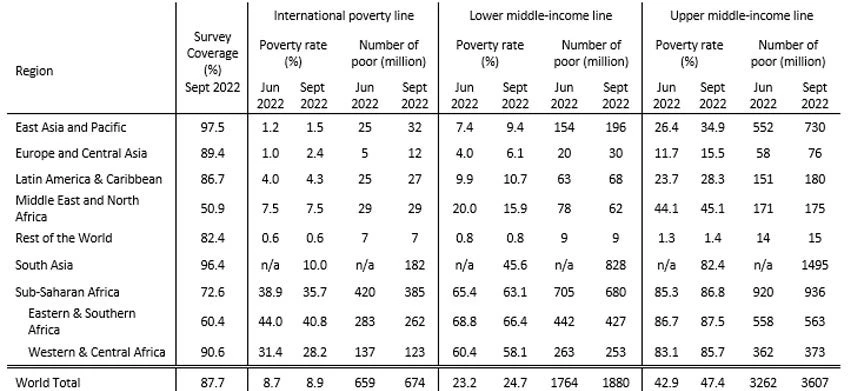
To understand the impact of these various changes (i.e., switching PPPs and adding new data for India), it is useful to look at the regional trends: With the exception of South Asia, the observed regional changes reflect the PPP revisions. In South Asia, a more detailed analysis has shown that the PPP impact by itself is minimal (see Figure 1 here, Jolliffe et al. 2022). The PPPs have pushed up poverty rates in all other regions with the exception of Sub-Saharan Africa. In Sub-Saharan Africa, the adoption of the 2017 PPPs reduces the poverty rate from 38.9 percent to 35.7 percent. This change in Africa lowers the global poverty rate since almost two-thirds of the global extreme poor people live there. Hence, the adoption of the 2017 PPPs by themselves would have reduced the extreme poverty rate in 2018 by 0.2 percentage points (see Table 3 here, Jolliffe et al. 2022). You might be wondering how the international poverty line can increase by a quarter of a dollar (from $1.90 to $2.15), while the number of poor people in Africa decreases. The answer is that the 2017 PPPs revealed that the purchasing power in some populous African countries was greater than previously thought, making households in these countries less poor than previously thought.
The PIP website also now includes five new rounds of survey data for India (2015/16, 2016/17, 2017/18, 2018/19, 2019/20). These data are based on the work by Roy and Van der Weide (2022) who use household survey data from the Consumer Pyramids Household Survey (CPHS) conducted by the Center for Monitoring Indian Economy (CMIE). With these new data, poverty in India has declined in recent years, but less than previously estimated (see Figure 2 here). Hence, the inclusion of the new data leads to an increase in the poverty rate in India and South Asia, as well as the world (more than offsetting the PPP impact described above). Earlier estimates suggested a poverty headcount rate at the $1.90 poverty line (and 2011 PPPs) of 10.4 percent in 2017, compared with 13.6 percent in Roy and Van der Weide (2022).
This discussion so far has focused on the international poverty line, which is used for the Sustainable Development Goals. At the higher global lines, the upward revisions to the 2018 poverty estimates are somewhat larger. Since Sub-Saharan Africa has a smaller share of the global poor at these higher lines – it accounts for almost two-thirds at the international poverty line, one-third at the LMIC line, and one quarter at the UMIC line – the downward push from the PPP revisions in Sub-Saharan Africa is more muted and the India effect dominates. Also, at the highest line of $6.85, which is typical of the national poverty lines used in upper middle-income countries, there is an additional effect: in addition to the nominal changes (i.e., going from 2011 to 2017 prices), upper middle-income countries raised their national poverty lines in real terms, implying that the UMIC line is now a higher standard in real terms (see p. 27 here).
Looking at the recent trends, global extreme poverty has declined slightly between 2018 and 2019, with the poverty rate at the international poverty line decreasing from 8.9 to 8.4 percent ($2.15, 2017 PPPs; see figure below). The Poverty and Shared Prosperity report 2022, to be launched in October 2022, will analyze these trends in further detail. It will also include updated estimates of global poverty during the COVID-19 pandemic, nowcasts to 2022, and projections to 2030.
Today’s PIP update also improves the platform’s functionality. While PIP’s default estimates now use the 2017 PPPs, users can easily switch to a legacy series that uses the 2011 PPPs. Some users may prefer to continue using the 2011 PPPs, considering the recommendation by the Atkinson Commission not to update the PPPs until 2030. It also partially addresses another Atkinson’s recommendation that the World Bank should provide a sense of the uncertainty (i.e. Atkinson’s “total error” recommendation) surrounding its global poverty estimates. Finally, together with the open code and vintage control, this PIP feature aims to improve the transparency of the World Bank’s poverty numbers.
The authors gratefully acknowledge financial support from the UK Government through the Data and Evidence for Tackling Extreme Poverty (DEEP) Research Program.


Join the Conversation