 Credit: The BOMA project
According to The State of Economic Inclusion (SEI) Report 2021: The Potential to Scale, economic inclusion programming is surging globally, driven by the scale-up of government-led programs that build on social protection, livelihoods and jobs, and financial inclusion interventions. In fact, in the World Bank’s overall COVID-19 response, economic inclusion programs are an essential part of a policy toolkit to mitigate the impacts of the COVID-19 pandemic, ensure food security, and support a medium-term recovery.
The Partnership for Economic Inclusion (PEI) Landscape Survey 2020 underpins the SEI Report 2021, which presents—for the first time—a systematic review of economic inclusion programs worldwide. The survey identified 219 economic inclusion programs in 75 countries reaching over 90 million people, mostly in Sub-Saharan Africa and South Asia. Data from the survey are now available on PEI’s open source Data Portal. The portal consists of a Landscape Dashboard with an overview of active economic inclusion programs, coverage, objectives, target groups, and more (figure 1). A Costing Dashboard and a Program Database are available as well.
Figure 1. PEI’s Landscape Dashboard: program objectives and target groups

A unique feature of PEI’s Data Portal is its snapshot of the key design and implementation aspects of economic inclusion programs globally. From this snapshot, policy makers and practitioners gain insights into what others are doing in different settings and for different target groups. In that way, they are better prepared to design programs and operations and scale up strategies.
Here are five takeaways on program design and implementation emerging from the data:
1) Economic inclusion programming is diverse. Whether working within a governmental or a nongovernmental organization (NGO), program planners are driven by priorities shaped at the policy, political, and organizational levels. Those priorities take into account the country or regional context, local partners, their institutional cultures, and the unique challenges confronted by people living in extreme poverty and vulnerability in that locality.
2) Economic inclusion programs are under way in a range of sectors—social protection, agricultural, and environmental, among others—and they are increasingly focused on climate change priorities. Overwhelmingly, programs in the Middle East and North Africa (81%) and Latin America and the Caribbean (71%) are seeking to increase wage- and self-employment opportunities. By contrast, programs in South Asia (50 %) and Sub-Saharan Africa (40%) are predominantly aiming to support income diversification and resilience. Economic inclusion programs are well positioned to support a green, resilient, and inclusive post-COVID- economy. According to the SEI Report 2021, 65% of World Bank economic inclusion programs are seeking to mitigate climate change and develop sustainable livelihoods through sustainable natural resource management or climate change adaptation.
3) Economic inclusion programs are adaptable to a variety of geographic, political, and income contexts as well as a range of target groups. These programs operate in both urban and rural contexts, displacement-affected and fragile areas, and low- and even high-income countries (figure 2). This flexibility suggests that programs are able to address the many needs of specific vulnerable groups. For example, multidimensional economic inclusion programs are well placed to help overcome the challenges faced by people with disabilities who are seeking to expand their economic opportunities. In South Asia, 44% of programs surveyed in the SEI Report 2021 target marginalization of indigenous populations and other vulnerable groups.
Figure 2. PEI’s Landscape Dashboard: program coverage and context

4) Women and youth are a priority. Nearly 90% of the 219 programs surveyed are focusing on gender. Programs that predominantly serve women build the skills and confidence of female participants through training and coaching. 64% of programs are targeting youth, mainly aiming to achieve better employment outcomes (both wage and self-employment). 82% of the 125 programs serving youth are promoting employment opportunities by combining training and coaching with wage employment facilitation or business financial support.
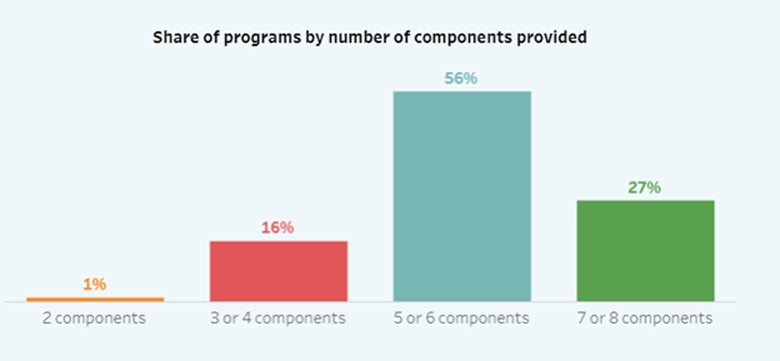
5) Economic inclusion programs offer an integrated package of interventions to address the many constraints faced by the poorest and most vulnerable people. 83% of the 219 programs surveyed (75% of government-led and 91% of nongovernment-led) are providing economic inclusion packages that have five or more broad components (figure 3). Programs most commonly include transfers, skills training, coaching, and financial services facilitation. Program components are frequently provided in sequence and in a time-bound period, which may be from one to three years.
Figure 3. Share of economic inclusion programs, by number of components provided
Contributing to PEI’s Data Portal: A call to action
There is still much to learn about economic inclusion programs worldwide, and the PEI team invites governments, NGOs, researchers, and others to contribute data to broaden the collective knowledge. One area for deeper exploration is economic inclusion programs in fragile settings. These programs are growing quickly, but understanding of the operational models is still slim. Programs that link economic inclusion to humanitarian interventions and facilitate market linkages in fragile settings will provide useful insights into how to design programs that help governments nurture self-reliance in refugees and displacement-affected people. With your help, PEI can continue to contribute to the landscape of economic inclusion programs by capturing both data from programs not already mapped as well as data updates from those already included. Benefitting from a better information flow and open access data, PEI can continue to support learning and help improve program delivery.


Join the Conversation