 Une plateforme de forage pétrolier et gazier dans le golfe de Thaïlande. Photo : © Red ivory/Shutterstock
Several commodity agreements were put in place after World War II to stabilize prices, and renewed efforts took place after the 1970s commodities price boom, typically backed by the United Nations. While these agreements initially stabilized markets and supported prices, over the longer term, higher prices led to lower demand and spurred investment and innovation that brought new suppliers to the market. The Organization of Petroleum Exporting Countries (OPEC) and its agreements with other major oil producers is the only remaining such effort. It is likely the oil agreement will eventually be subject to the same shortcomings that prompted the demise of earlier arrangements.
The early agricultural commodity agreements
The International Tin Agreement (ITA) was first negotiated in 1954 to maintain tin prices within a desired range through the management of buffer stocks. During its three decades of activity, ITA was able to raise and stabilize tin prices. However, in October 1985 ITA became insolvent and had to suspend its stabilizing activities. As the agreement collapsed, tin prices plummeted (in the short term) and numerous mines closed.
In 1962, most coffee-producing countries and almost all developed coffee-consuming countries signed the International Coffee Agreement (ICA) to stabilize world coffee prices through mandatory export quotas. The export quota system succeeded in stabilizing coffee prices despite large fluctuations in global coffee production. However, pressures on ICA mounted following the emergence of new coffee supplies. Because key producers could not reach an agreement on how to allocate export quotas, the Coffee Agreement was suspended in July 1989. Following the suspension, coffee prices fell 40 percent.
The International Natural Rubber Agreement (INRA), went into effect in 1979 and collapsed during the East Asian Financial Crisis due to currency developments in three key producers: Indonesia, Malaysia, and Thailand. A buffer stock of rubber had been used to maintain rubber prices. However, when global demand for natural rubber collapsed, INRA could no longer maintain the buffer stocks. The agreement became unsustainable and collapsed in December 1999.
The oil market
The oil market has also been subject to supply management throughout its history. In the United States, the oil industry has been regulated from the mid-1930s to the early 1970s through state quotas by the Texas Railroad Commission (TRC) and import controls via the Mandatory Oil Import Quota program of 1959. In response to these measures, OPEC was founded in 1960, and was largely modelled after the TRC. At the time, it accounted for 40 percent of global oil production.
OPEC Oil Production as a Share of Global Production
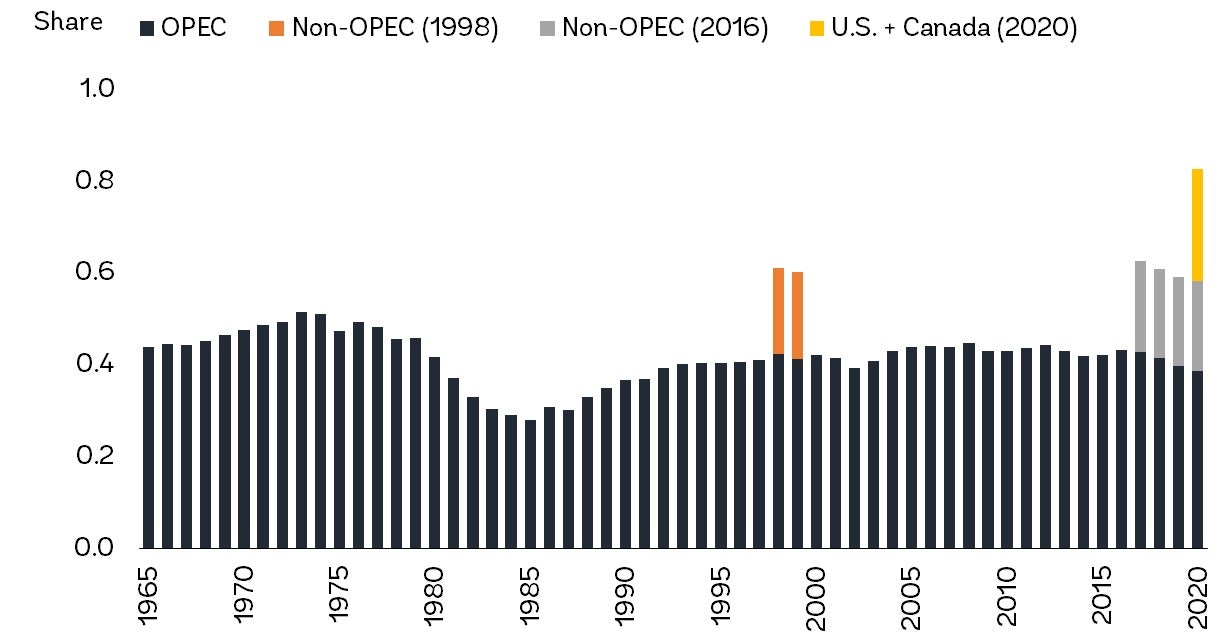
Notes: Non-OPEC (1998) includes Norway, Mexico, Oman and Russia. Non-OPEC (2016) includes Azerbaijan, Bahrain, Brunei, Kazakhstan, Malaysia, Mexico, Oman, Russia, Sudan and South Sudan. U.S. + Canada (2020) offered to contribute production reductions through market and voluntary contractions. Shares of 2020 are as of April 2020.
OPEC began to significantly affect the oil market in 1973. Following the 1973-1974 oil embargo, it quadrupled oil prices. A large loss of oil supply during the 1979 Iranian revolution caused oil prices to spike further. OPEC chose to restrict supplies and keep prices high during the first half of the 1980s. However, by 1985, Saudi Arabia’s oil production had fallen by almost two-thirds, and the country was on a path to being driven out of the market. To regain market share, Saudi Arabia raised production by more than 40 percent within a year, leading to a collapse in oil prices. Following the price plunge, OPEC members agreed to reengage in production cuts.
The reduction came at an important juncture: the global economy was recovering from the Asian Financial Crisis, and industrial commodity markets were beginning to experience one of the largest demand booms in recent history, led by emerging market and developing economies (EMDEs), especially China. By January 2008, oil prices exceeded $100/bbl.
Historical Averages of Crude Oil Prices and Major Events

Note: Crude oil price represents the historical average Brent, Dubai, and WTI. Last observation is April 2020 (as of April 17). Shaded areas denote large price declines, which prompted OPEC to engage in significant production cuts.
The commodity price agreement pattern began to repeat itself. High oil prices during the late 2000s brought new oil suppliers in the global oil market, including producers of biofuels, Canadian oil sands, and, most importantly, U.S. shale oil. In response to growing oil supplies and receding geopolitical concerns, oil prices slipped lower in 2014. Despite market expectations, OPEC opted not to reduce output November 2014 meetings, and oil prices plunged to a low of $30/bbl in January 2016. Although low oil prices slowed non-OPEC output growth, the U.S. shale industry proved resilient owing to cost cuts, efficiency gains, and innovation. OPEC decided to resume production cuts at its September 2016 meeting by inviting non-OPEC oil producers to participate, most importantly Russia and Mexico—as it did in the aftermath of the East Asian Financial Crisis.
Share of Global Oil Production
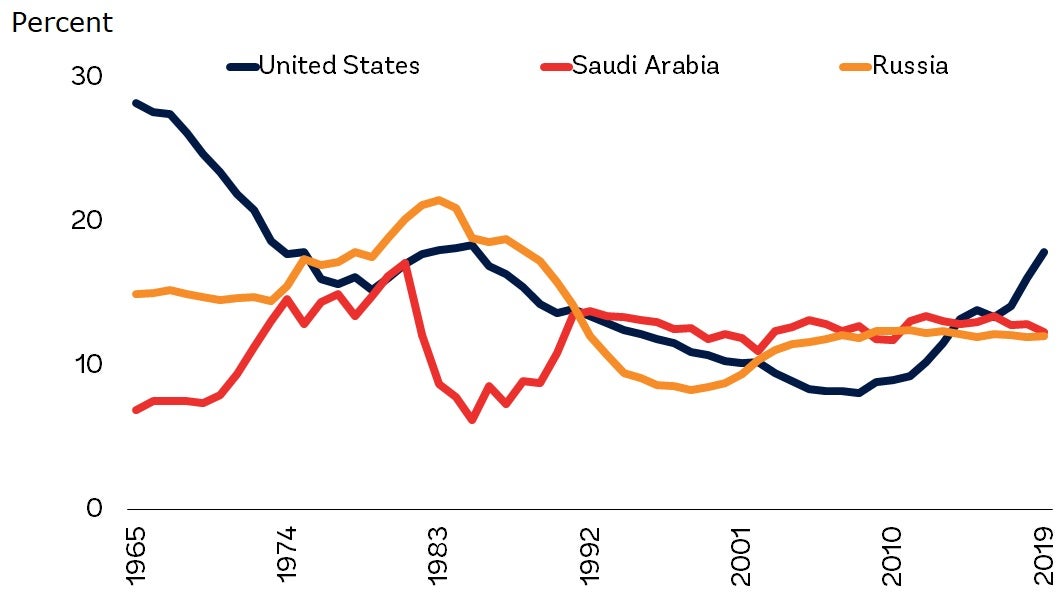
Note: The data series represent the oil production as a share of global production by United States, Saudi Arabia and Russia respectively.
The OPEC+ agreement in response to the COVID-19 pandemic
The COVID-19 pandemic, which led to an unprecedented collapse in oil demand and prices, has once again triggered efforts to shore up the oil market. In March 2020, OPEC+, as the organization and its associates are referred to, failed to extend its agreed production curbs. Oil demand, however, began experiencing one of the sharpest contractions in recent history due to the halt in travel as a result of the outbreak.
For the first time, the global oil market was simultaneously subject to a policy-driven supply expansion along with an unprecedented collapse in demand—the largest decline on record. Oil prices collapsed, with one measure, Brent, falling to multi-decade lows by the end of March. With estimates that oil demand could drop as much as 10 percent in 2020, 23 oil producers (including Russia, Saudi Arabia, and the United States) agreed on April 12 to a historic production cut of nearly 10 million barrels per day.
Such coordinated effort to stabilize the oil market provided some benefit to oil markets, as prices soon reversed course. However, it is likely that over the longer term, the most recent OPEC agreement will be subject to the same shortcomings that prompted the demise of earlier arrangements—substitution and efficiency gains, and the entry of new producers that operate outside the agreement.
RELATED
The World Bank Group and COVID-19
A Shock Like No Other: Coronavirus Rattles Commodity Markets
The outlook for commodity markets, and the effects of coronavirus, in six charts

Join the Conversation