COVID-19 has made face-to-face data collection increasingly difficult, obscuring our view of the economic impact of the pandemic and consequent containment measures on the world’s poor and vulnerable. In response, the World Bank and partners have launched phone surveys of households to understand the changing economic situation in over 100 countries worldwide. But keeping track and quickly viewing the rich stories told by immense volume of survey data is a challenge.
A new interactive COVID-19 High-Frequency Monitoring dashboard will help us better understand how the impact of the pandemic varies across countries and over time. It will display the results of COVID-19 high-frequency surveys in around 35 countries. The number of countries is expected to climb to 70 countries by the end of 2020 and over 100 countries by next year.
"A new interactive COVID-19 High-Frequency Monitoring dashboard will help us better understand how the impact of the pandemic varies across countries and over time."
“This is a unique and unprecedented data collection effort for the World Bank, in terms of the number of countries covered and the speed of design and implementation,” said Carolina Sánchez-Páramo, Global Director of Poverty and Equity. “And providing access to all these data through this dashboard is an important milestone in our efforts to translate the complex work the Bank does into an accessible public good.”
The surveys provide a wealth of information about how the crisis affects the lives and well-being of households and individuals, how they are coping with its impacts, and whether private and public assistance is reaching the neediest, which in turn informs policy responses.
In Zambia, for example, World Bank staff used survey data to design a cash transfer program. And in Indonesia, government officials used survey findings to inform COVID-19 responses such as the extension of social assistance programs and wage subsidies, and to monitor the disbursement and coverage of economic relief programs.
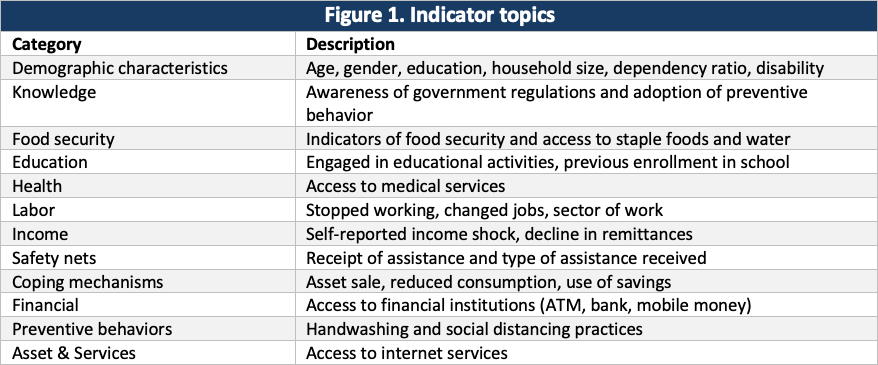
The dashboard provides easy access to cross-country comparable information on over 80 indicators, covering 14 key topics such as understanding of the pandemic, access to food, changes in employment, income loss, access to safety nets and household coping strategies (see Figure 1). The full list of indicators can be found here.
Over the last few months, World Bank poverty economists have worked hard to process and publish country level results from COVID-19 surveys as quickly as possible to inform the response to the COVID-19 crisis. The new dashboard builds on these efforts by providing a one-stop shop for those interested in cross-country comparable information and analysis. Specifically, the dashboard allows users to analyze the impacts of COVID-19 and explore how these vary across countries over time, and within countries, across industries and locations. All data can be downloaded for further analysis.
"The new dashboard builds on these efforts by providing a one-stop shop for those interested in cross-country comparable information and analysis."
A tracking map with information on the implementation status of high-frequency monitoring surveys at the country level, as well as details on whether individual surveys already been added to the dashboard, can be found below.
Harmonization efforts focused on questions that were included in a large share of surveys, as well as topics of interest for monitoring welfare during the crisis. Having said this, not all questions are asked in all surveys included in the dashboard. In cases when a specific question is not included in the survey or is asked in a way that does not allow for harmonization, the corresponding indicator is coded as missing in the database. More details on this and other methodological decisions can be found in our data dictionary and technical note.
It is also important to keep in mind that, because of the time and logistical constraints associated with phone surveys, the information collected is only representative of phone owners who are willing to respond to the survey. This is different from traditional household surveys, which seek to collect information on all household members. To the extent that phone owners are different from other population groups, surveys results could suffer from bias; and because phone ownership varies across countries, these differences could also affect cross-country comparability. To minimize these risks, whenever possible survey results have been reweighted to eliminate potential biases and ensure representativeness at the national level and comparability across countries.
Creating this dashboard could not have been possible without the work of several teams that contributed to the design of survey instruments and data collection, as well as preparing and aggregating the data displayed. The full list of people working on the COVID-19 High Frequency Monitoring Team can be found here.
RELATED
High-Frequency Monitoring Systems to Track the Impacts of the COVID-19 Pandemic
COVID-19 High-Frequency Monitoring Dashboard
The World Bank Group’s Response to the COVID-19 (coronavirus) Pandemic


Join the Conversation