
January in Chitral, a mostly rural district tucked away in the mountainous north of Pakistan’s Khyber Pakhtunkhwa Province – KP, for short. With temperatures well below freezing point, up to half of middle and secondary school children face a frosty commute of over two kilometers, walking along mostly unpaved and deteriorating roads. The prospect of the same strenuous journey in the burning July heat seems distant, yet not more appealing. No wonder that, alongside poor education quality and high costs, long commutes are a major barrier to education access in Pakistan.
Geography and the availability, quality, and climate-resilience of services and transport infrastructure jointly determine access to services and opportunities. This is illustrated by the vast disparities in distances to school between urban and rural parts of KP Province. Data from the Pakistan Communication and Works Department indicate that for 44% of Khyber Pakhtunkhwa Province’s rural population, primary school is more than a 30-minute drive away, a figure as high as 80% in some districts. For middle and secondary schools, the gaps are even higher. Such disparities in service access, be it to education, healthcare, markets, or administrative services, are widely, but imprecisely, documented. Data tend to be derived from larger-scale surveys or case studies with a limited geographic scope.
Previous studies have tried to resolve this issue by modeling access approximately, for instance by counting populations within straight-line distances around services. However, approximative techniques imply approximative results. Such studies can’t accurately quantify and visualize disparities in service provision at small scales across larger areas, particularly where terrain or poor infrastructure complicate travel. This makes it hard to connect known service access disparities to disparities in socioeconomic and human development, let alone design well-targeted policies and projects to address them.
The Pakistan Poverty and Equity team, in collaboration with the Transport team, therefore developed a methodology and toolkit to measure and visualize disparities in service accessibility at small scales. This openly available toolkit quantifies current access conditions and simulates potential improvements in accessibility through rehabilitation or construction of specific roads. Data-driven investment decisions and policies can then be optimized regarding the location and mix of new services or transportation upgrades. These accessibility analyses are replicable and scalable to most combinations of investments and/or geographic contexts. For KP Province alone, analyses have been performed for access to schools, health centers, administrative centers, and agricultural markets in urban and remote, rural areas.
Measuring accessibility at a small scale

Many geographic determinants complicate simple accessibility models. While road, service, and settlement information allow the calculation of distances, computing travel times is more complicated. The terrain, landcover, climate, mode of transport, and quality of roads impact travel speeds. The Poverty and Transport teams, therefore, developed a methodology to calculate the ‘friction’ slowing down or speeding up travel for every on- and off-road area at a high resolution based on these characteristics. Through ‘friction surfaces’, travel times between communities and services can be estimated at very small scales. This greatly improves access estimates and allows the preparation of metrics at any policy-relevant scale.
The accessibility analyses substantiate evidence-based decisions to level the playing field by closing geographic gaps in service provision. Decisions on service locations and transportation networks can be optimized by analyzing the resulting patterns of accessibility at finer scales and linking them to welfare outcomes. This will allow deprived communities to vastly improve socioeconomic and human development outcomes.
Beyond investments in new services, this method also simulates the potential for relative improvements in service accessibility due to hypothetical road upgrades. A rehabilitated or new road will increase travel speeds and lower travel times to services. Subtracting ‘before’ and ‘after’ access figures puts a number on the time-wise access improvements for each potential investment in the road network. This paints a picture of where road upgrades are most beneficial for the population.
Paving the way to education for all in KP Province
How can this theoretical exercise help students battling the cold or heat on the way to school in KP Province? Wanting to know where in the province the largest groups of students had the lowest education access, the Pakistan Poverty and Transport teams set out to identify spatial disparities in school access for small-scale administrative units, called tehsils.
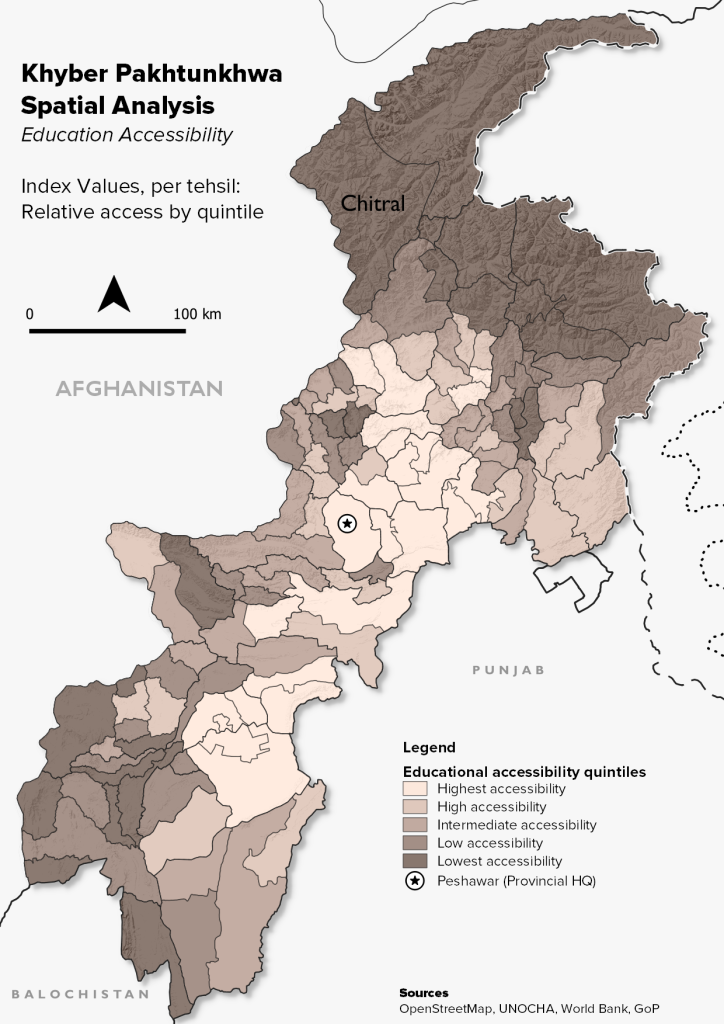
Bringing together governmental and publicly available data, we computed a KP Province-wide friction surface with a 30-meter resolution. Overlaying this with a population grid and aggregating travel times to primary, middle, and high schools for tehsils delivers a detailed image of disparities in access to education (figure 1). Tehsils in the mountainous north, including Chitral, and rural southwest of the province consistently fall in the quintiles with the lowest accessibility to school. Children living in these areas are thus confronted with structural inequalities in learning opportunities.
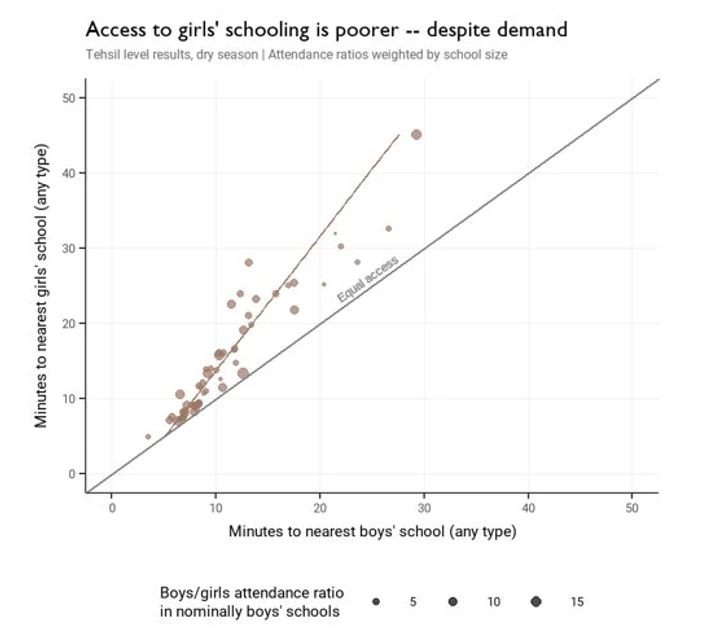
Improving girls’ access to education is of special interest for Pakistan, as per the Country Partnership Framework 2021-2026. Therefore, we computed gendered access to boys’ and girls’ schools. The result is shown in figure 2. Compared to an equal-access scenario, girls consistently have longer travel times to school. In areas where boys travel for 20 minutes on average, girls’ commuting time is 50% longer—and this difference increases with longer overall commutes. Northern tehsils again show the strongest disparities. This deprivation is also compounded. Aside from reduced educational accessibility, Chitral also is one of the most vulnerable districts to natural hazards in the Province. In 2015, for instance, floods and landslides ravaged homes, roads, and electricity and irrigation infrastructure.
The accessibility analyses thus provide strong evidence for prioritizing investments in education in the north of the province, benefitting girls especially.
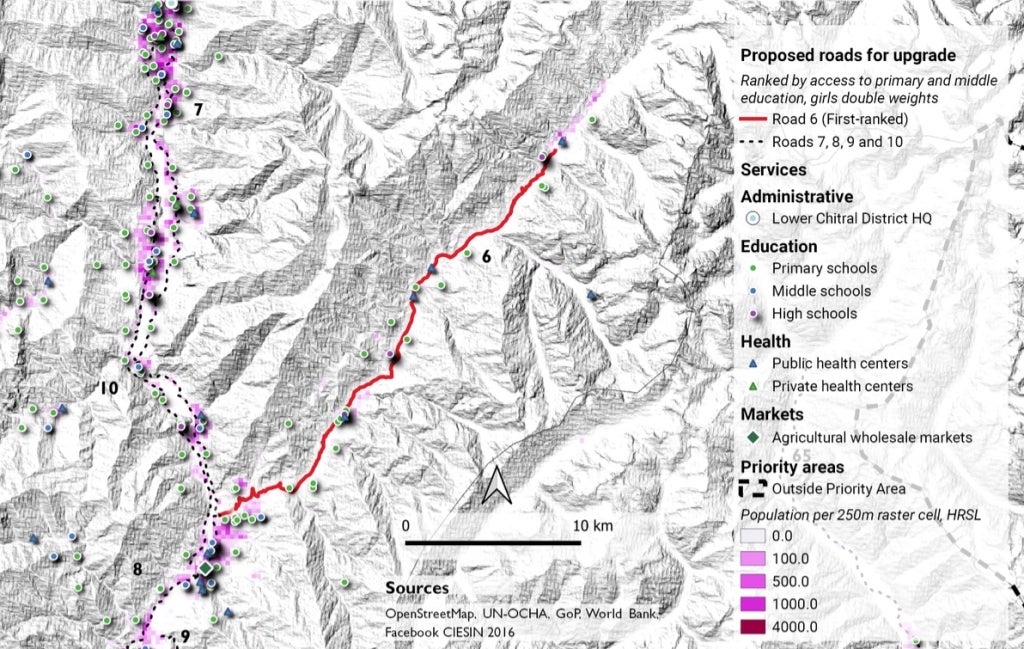
Beyond investing in new school infrastructure, access to education can also be improved through upgrades of the rural road network. Funding for the maintenance of rural roads is severely limited, resulting in their progressive deterioration. The Provincial Government of KP, therefore, proposed rural roads for upgrade through the Bank-funded KP Rural Accessibility Project (KPRAP), which is currently being designed. We computed which road investments offer the highest improvements in accessibility relative to the status quo. Consistent with the tehsil-level findings, roads located in the districts with the lowest accessibility and highest gender disparities would provide the greatest improvements in accessibility if upgraded. An example is shown below for ‘Road 6’, the road holding the greatest potential for access improvements, located in Chitral (figure 3). This evidence can be translated into policy and steer investment decisions through KPRAP, directly benefiting the girls and boys commuting to school in the Chitral cold.
Implementing accessibility analyses
Accessibility analyses like the ones carried out for KP Province are replicable and scalable to other geographic contexts and types of investments. In South Asia alone, World Bank teams have used similar methodologies for a variety of essential services and opportunities in Afghanistan, Bangladesh, Bhutan, Nepal, and Sri Lanka. They are critical to enable data-driven service investment decisions and to design coherent policies to close spatial disparities in service accessibility in areas where rough terrain complicates measurements and spatial precision is required. As such, accessibility analyses are rapidly gaining ground as core inputs into World Bank transport infrastructure and service provision analytics, as well as a key ingredient in Government clients’ evidence base for essential service policies and investment decisions.


Join the Conversation