Today, the World Bank published the 2020 Atlas of Sustainable Development Goals. This year’s Atlas is a web publication that guides readers through the Sustainable Development Goals (SDGs) using interactive storytelling and innovative data visualizations.
Expanding understanding of key trends
The SDGs seek to guide global action to address many of the world’s greatest challenges such as eradicating poverty, eliminating hunger, expanding access to education, achieving gender equality, and addressing the climate crisis. The Atlas aims to expand understanding of key SDG indicators and trends, which is important for measuring progress and directing action. The 2020 edition seeks new and creative ways to expand understanding of each of the 17 goals.
Building on collective insights
The Atlas relies on insights and expertise from subject specialists, data scientists, and statisticians at the World Bank, as well as a talented team of data visualization designers. This Atlas would not be possible without the Bank's ongoing work with partner countries and UN agencies in monitoring the SDGs and improving measurement.
Telling new stories through creative visuals
Taking a storytelling approach, this year’s Atlas explores selected targets for each goal, and highlights trends towards achieving the SDGs. It also introduces concepts that inform readers about how some of the SDGs are measured. Where data is available, the chapters highlight some of the emerging impact of the COVID-19 pandemic on the indicators and trends presented.
Readers will explore SDGs through an interactive experience. For instance, in the chapter focusing on SDG 10, we explain a conceptually complex topic, income inequality, using dynamic charts and narratives to showcase different country examples.
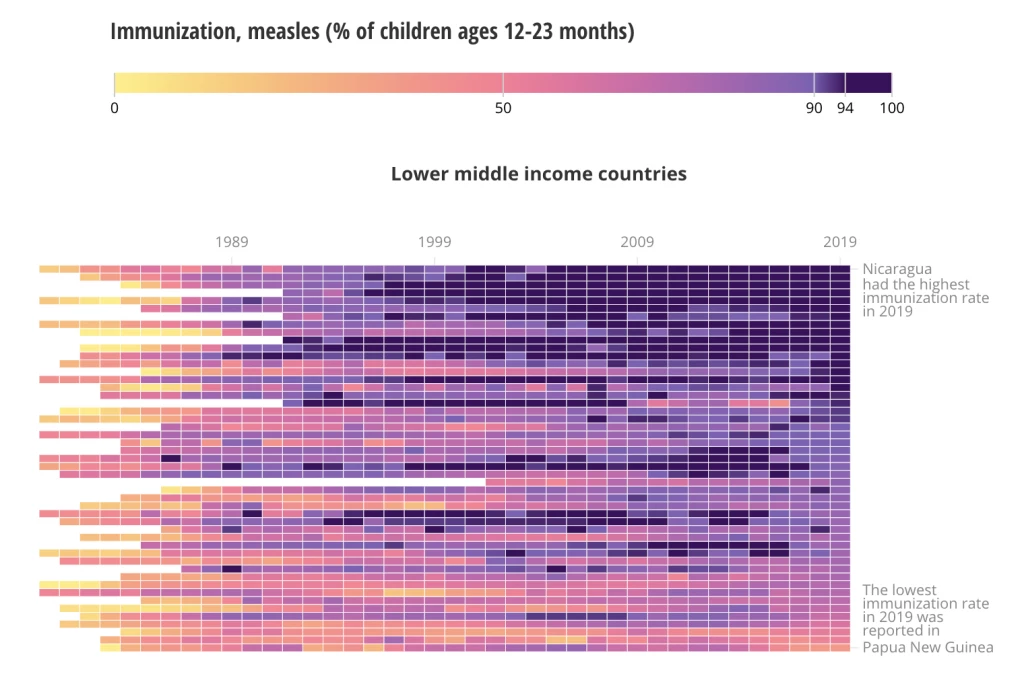
This visual in Chapter 3 (Good health and well-being) allows the reader to quickly see the trend in measles immunization within an income group and in each individual country over 40 years.
In Chapter 4 (Quality education) readers can easily compare relative and absolute trends in ‘learning poverty’ with a visually friendly spin on a regular bar chart (Marimekko) in one visual.
In Chapter 7 (Affordable and clean energy), readers can explore nighttime satellite imagery to see how different parts of the globe with similar populations have very different light output—reflecting underlying unequal access to electricity.
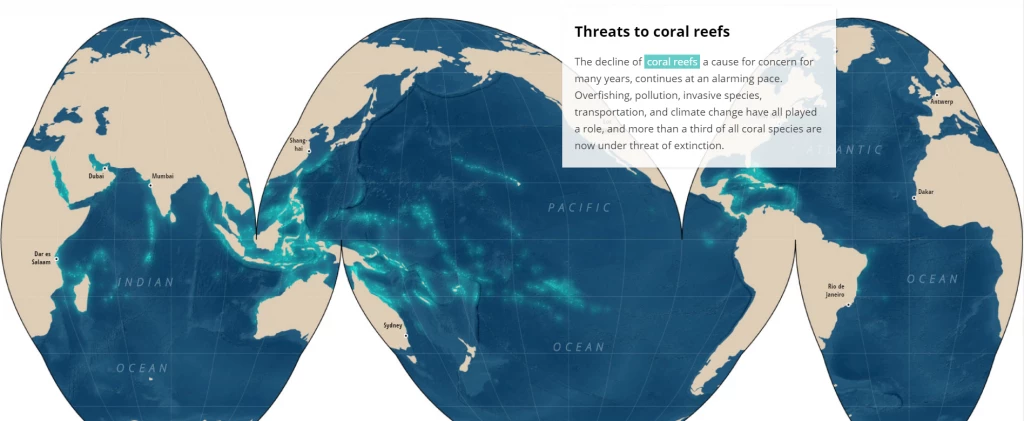
In Chapter 14 (Life under water), the world map focuses on oceans instead of continents, making it easy to see the distribution of endangered marine life, such as corals.
These are just some of the visuals and stories the 2020 Atlas offers. The data in the Atlas draws from the World Bank’s World Development Indicators and explores new data from scientists and researchers worldwide.
We hope readers will find the latest edition engaging and informative and will be inspired to discover, understand and visualize progress towards achieving the Sustainable Development Goals.
We would like to thank the World Bank Group’s Partnership Fund for the Sustainable Development Goals (SDG Fund) for their generous support.


Join the Conversation