Latest & Top Posts


World Bank Group Country Classifications by Income Level


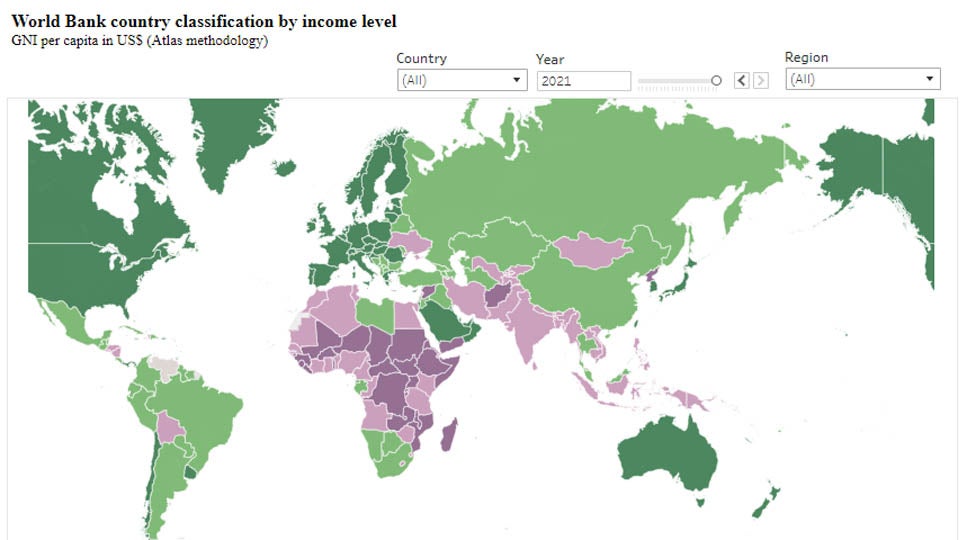
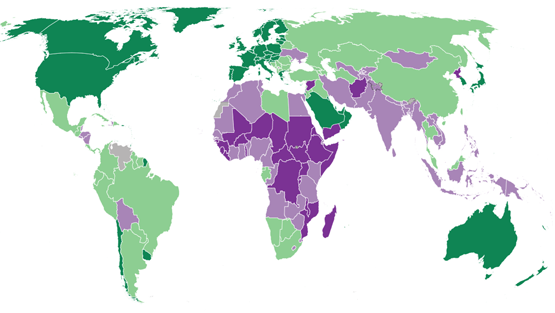

Atlas of Global Development 2026

The global internet gap: What the data tells us
July 07, 2026
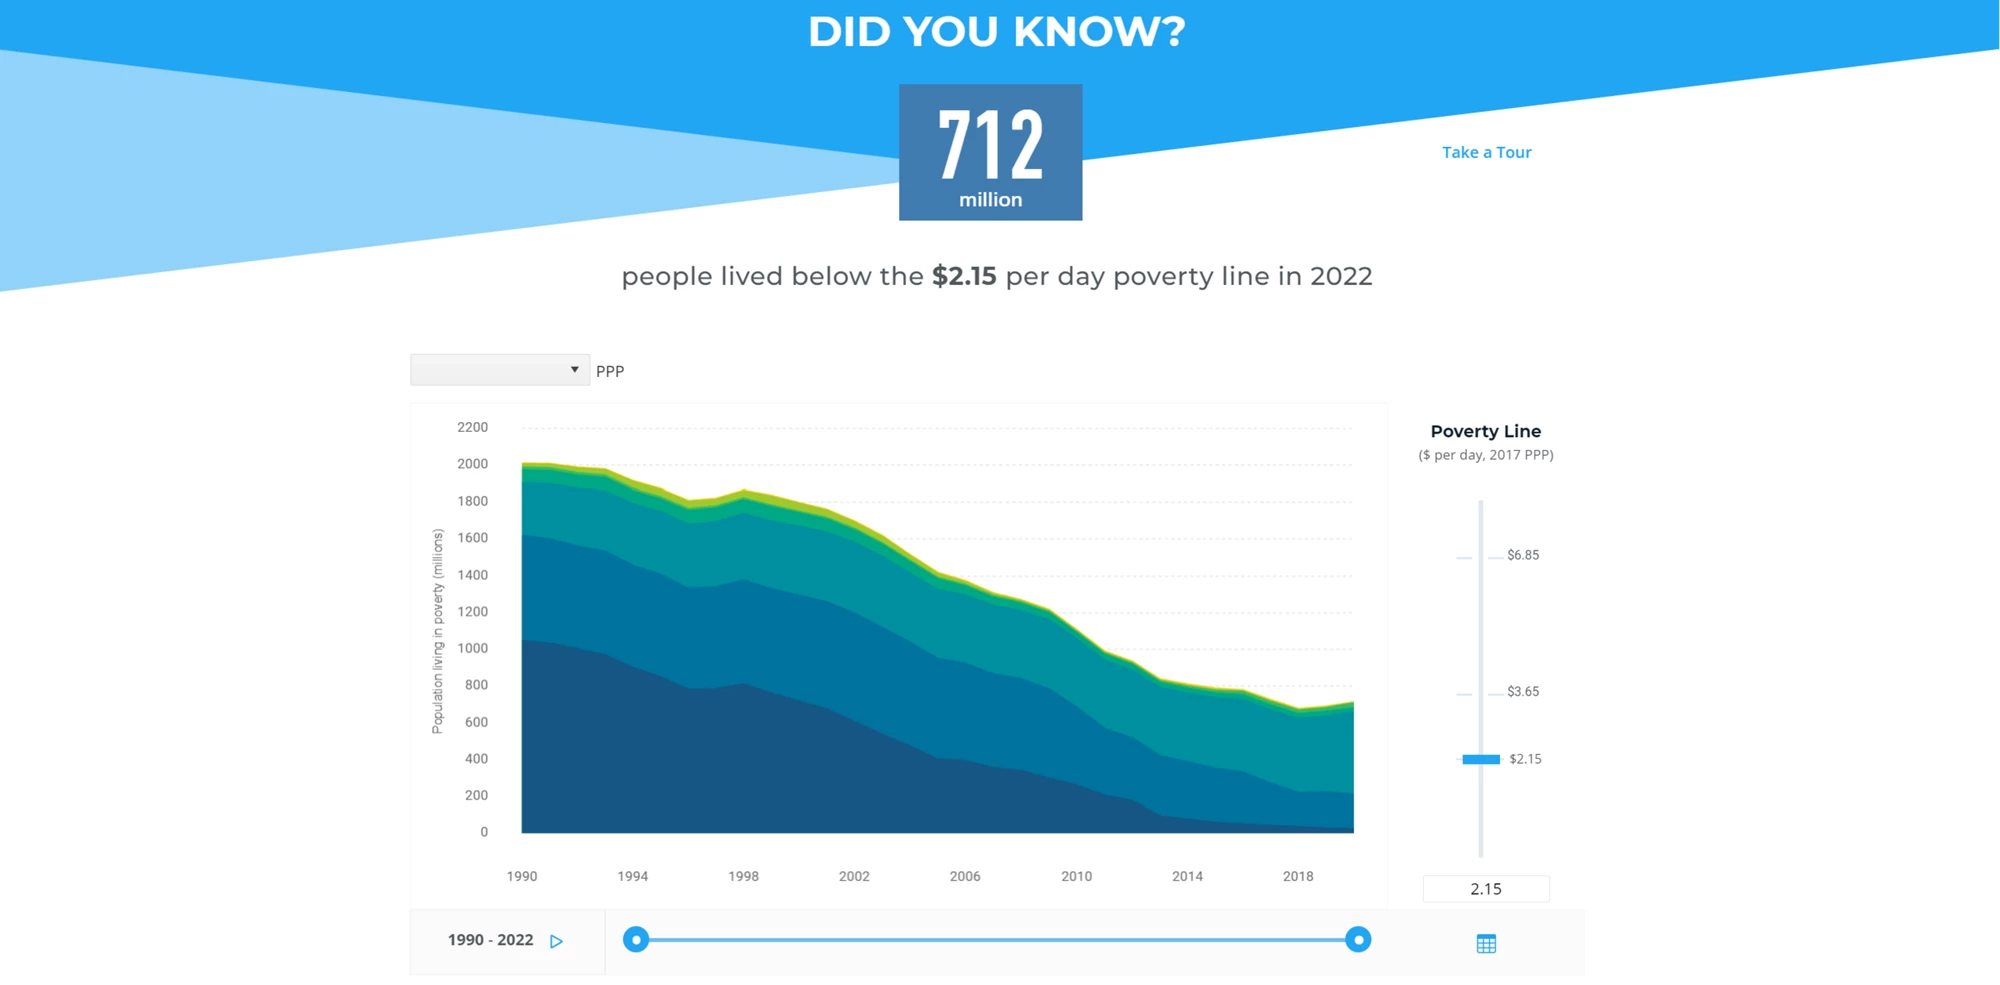
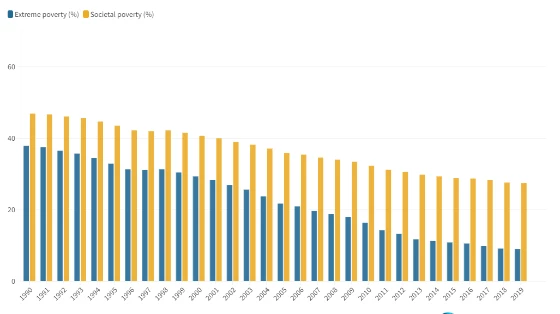
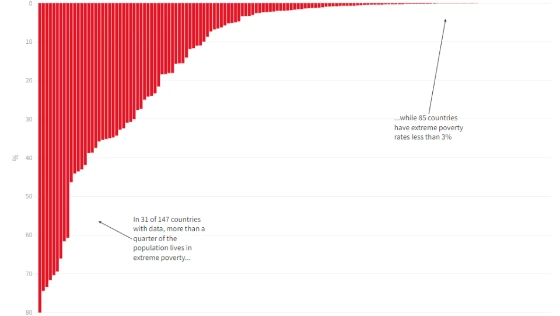
Extreme poverty: hard-won gains, new risks ahead
June 18, 2026
Poverty and Inequality Platform (PIP)


Updated estimates of the Prosperity Gap
October 26, 2023
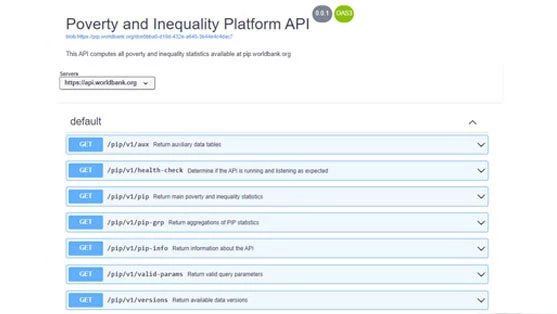
How to use PIP’s API
June 13, 2022
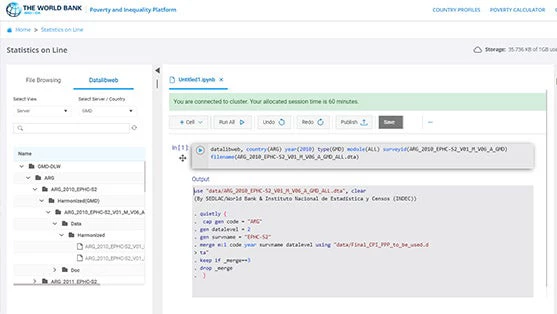
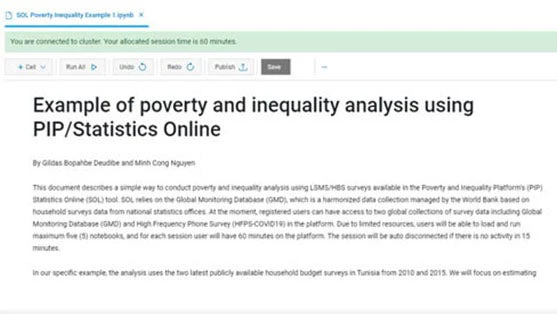
How to use PIP’s Statistics Online (SOL)
June 06, 2022
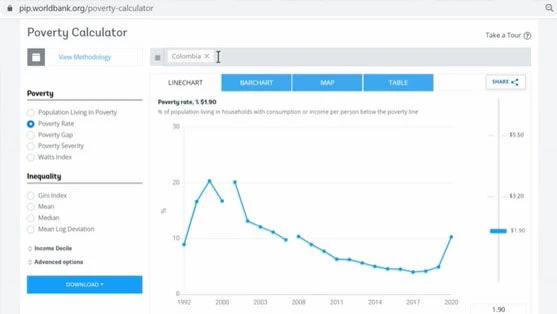
How to use PIP’s Poverty Calculator page
May 31, 2022
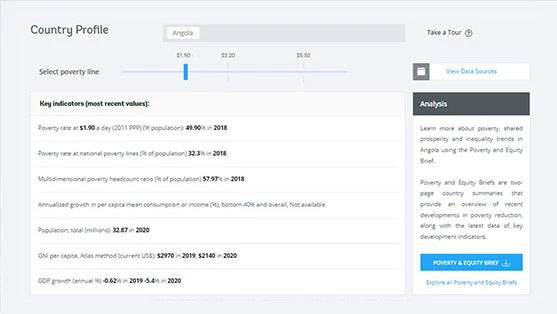
How to use PIP’s Country Profiles page
May 23, 2022
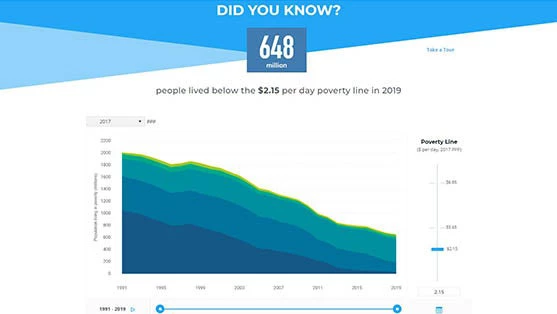
How to use the PIP Homepage
May 16, 2022
Commodity Markets Outlook 2026

Beverage prices retreat as supplies recover
July 07, 2026

Precious metals retreat from record highs
June 26, 2026


Metal prices surge as supply pressures intensify
June 11, 2026


Strait of Hormuz disruption sends oil prices surging
May 07, 2026


Steady gains in agricultural raw material prices
May 28, 2026
Poverty, Prosperity, and Planet Report: Pathways Out of the Polycrisis

Declining trends in national inequality
January 29, 2025

Three ways to use the Prosperity Gap index
January 22, 2025

The Prosperity Gap incorporates a penalty for high inequality
January 15, 2025


Getting to zero: Focusing on IDA countries for ending poverty
November 21, 2024


The polycrisis behind a lost decade of poverty reduction
October 24, 2024

Blueprint for Change: Ending Poverty on a livable planet is possible
October 17, 2024
International Comparison Program

International Debt Report


The data behind the International Debt Report 2023
April 23, 2024
Celebrating 50 years of the International Debt Report
December 13, 2023